SOME
INITIAL RESULTS RECEIVED FROM THE DIKE MONITORING SYSTEM AT THE RED RIVER
DIKE SECTION IN THÁI
BÌNH PROVINCE
TRẦN
CÁNH1, ANDREAS WELLER2, RONALD LEWIS3
1Institute of Geological Sciences, VAST,
84, Chùa Láng Str., Đống Đa, Hà Nội.
2Institute of Geophysics, Clausthal
Technic University, Germany.
3 Planungsgesellschaft
Scholz + Lewis mbH, Dresden, Germany.
Abstract: This article displays an experimental dike
monitoring system which installed at a major point weak dike section
of Red River left dike in Thái
Bình Province.
The system consisting of geophysical and geotechnical equipments includes: 1.
Multi-electrode induced polarization (IP) instrument for observing structural
varieties of underground and resistivity changes caused by the variation of
water content; 2. The tensiometer TS for observing water pressure and
temperature in the dike body; 3. The electromagnetic sensor system
(FDR-Sensors) for determining the water content at different depths in the dike
body. This system has been operating since April 2006 and the interesting
information above the variations of geophysical parameters were received in the
flooding season of 2006-2007 and 2008-2009 years. The authors will present some
initial results received from this dike monitoring system.
I. INTRODUCTION
The dike system in the Red River Delta
includes more then 4000 km of river dikes, that have an important role for
protecting against flood and for socio-economic development in North Việt
Nam.
This system has been constructed over 200 years ago and consolidated through
different generations. The satisfied guarantee of this dike system in annual
flood is mission in the strategy of socio-economic development of the country.
The
river dike lines lie over different topographical areas and different
geological units containing many hidden threats for the dike body and its
fundaments, that can cause different damage events in the flood season.
According
to the annual reports of the National Dike Management Organ (2003) there are
more than 200 km of main point dikes according to more than hundred weak dike
places in the dike system in the Red River Delta, where one must prepare the
intended projects with materials and power for protecting again flood [6].
Vietnamese
and German geophysical researchers have been interesting the question on safety
of dike system in both countries since 1995, the applied results of geophysical
methods for river dike can be found out in the works [1-5, 10-12].
A new
research direction has been drawn from the strong flood in 2002 year in the Germany and Việt Nam, when some
river dike sections were broken. This demands the creation of a dike monitoring
system. This article presents some
initial results received from this work.
II. DIKE MONITORING SYSTEM
1. General
principles of dike monitoring system
In the flood season, the
water saturation in dike-component parts strongly increases, which makes
mechanic-physical character of dike materials in weak section not to attain the
criteria for dike safety. Data on variety of geophysical field and
geologic-geotechnical parameters in “weak foundation soil zone” is valuable
information for calculating a three-dimensional model to estimate dike states
(up-to standard or in possibly broken unstability). The tension of river water
on the dike body and foundation can be directly measured by tensiometer.
Indicators of water saturation increasing in direct ratio with the increase of
dike-forming material conductivity are measured by a multi-electrode
resistivity tomography data acquisition system with a series of specially made
electrode-sensors touching ground into dike body. Measurement results will be
standardized in comparison with tension data by tensiometers.
The acquired data may be
used to evaluate the state of the dike body during a high water event. The
resulting models are useful to predict stability criteria and to warn disasters
for dike.
Finally, a monitoring
system which can be operated automatically can be integrated in a complex
warning system. The remote system provides relevant data concerning the state
of the dike. The studied dike section
and locations installed with measuring instruments is showed in Figs. 1a, b and
c.
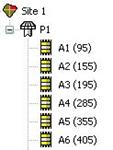
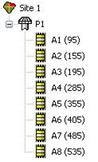
Figure 1a. Experimental
dike section and the locations the monitoring equipments installed at km
169+150 m, left Red River dike in Ngô Xá, Thái Bình Province.
Notes: 1. Electrical cables and multi-electrode array installed in the dike
cross section (depth 0.5 m from dike surface) with 50 electrodes and 1 m
spacing; 2. Locations where is installed steel pipe for measuring soil density;
3. Locations where are installed temperature sensors (T) and frequency domain
reflectometry sensors (FDR); H. Place of Data logger box for T and FDR; T.
Station for preserving equipments and periodically measuring IP.
|

Figure 1b. In
the place where river water level is measured daily.
|

Figure 1c. In
the place where groundwater level at the dike foot is measured daily.
|
2. Used technologies and instruments
The
new characters of the monitoring system are that, the measuring instruments
have high accuracy and little using power.
The dike monitoring system
consists of following technologies:
1. Multi-electrode induced
polarization instrument (IP) for observing structural varieties of underground
and resistivity changes caused by the variation of water content. The technical
parameters of equipment can be seen in [7].
2. Tensiometer (T) for
observing the water pressure and temperature in the dike body [8].
3. Electromagnetic sensor
system based on the principle of Domain Frequence Reflexometry sensors
(FDR-Sensors) for determining the water content at different depth in the dike
body [6].
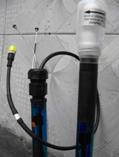
The physical principle and
technical parameters of T sensors and FDR sensors can be found in [6, 7]. The
Figure 2 indicates two FDR-sensors and T-sensors, which have been installed at
weak dike section in Thái
Bình Province.
4. Two places with equipments for observing
river water level and groundwater at the land-side at the dike foot (Fig. 1b,
c).
The IP measurement is
carried out by the software in notebook (Fig. 3a). The T and FDR-sensor systems
work automatically and data stored in memory of data logger.
Figure 2. The electro-magnetic
sensor systems and tensiometer T 8.
Notes: a. FDR
6 sensors system installed in dike body at land
side; b. FDR sensor; c. FDR 6 sensors system installed in dike
body at river side; d. Tensiometer for
measuring temperature in dike body.
a
b c
Figure 3. Reading data from
monitoring instruments at dike in Thái Bình.
Notes: a. Multi-electrode IP measurement for dike
cross section; b. Receiving data
from T and FDR sensor systems; c. Reading data of groundwater levels at the
dike foot.
III. INITIAL
RESULTS
1.
Results of geoelectric tomography survey
The
results of geoelectric tomography
survey reflect temporal changes of the water saturation of different dike
material layers in the dike cross-section. The resistivity images measured at
different times also indicate the change in dike body structure. In flood
times, if the measures will be carried out daily or continually, it will
receive disaster changes in the dike structure.
The
measurement is carried out monthly /weekly/daily by the equipment 4 P Hp (made
in Germany)
with configuration: Half-Wenner forward and backward.
The received data were
processed by the software DC2DSIRT that reduce the effect of dike
topography.
Figure 4 shows the
resistivity images in dike cross section received in the months July, September
and November, 2008. In these months the water level is high in river, reaching
from 2.60 to 3.97 m that is the water levels of alarm grad II and over grad II
in this dike section (alarm grad I is +2.48 m, II = + 3.12 m, III = + 4.13 m).
The resistivity images
show that the dike structure consists of clay with the resistivity value of 5 ÷
~ 80 Wm. The sand layer lies
in the depth of +1.0 to -3.5 m and the resistivity value of 15 ÷ 20 Wm having high permeability in flood time.
The resistivity
distribution in Figure 4, right side, reflects little change in the dike body
structure. In the felt side of Figure 4, we can see difference between normal
resistivity distribution (measured in January, 2008) and measured resistivity
distribution in percent. The change of resistivity distribution in dike
structure varies over ± 20%.
The geoelectrical data
contain image resistivity part, which is related to soil porosity. This will be
analyzed later.
2. Results of measurement by
tensiometer T8
Figure 5a shows the
change of water pressure in dike soil and of river water levels and groundwater
levels from 01/7/2007 to 11/9/2007. There are two flood times showed in Figure
5a and in Table 1. The Figure 5a shows that the change of river and groundwater
is influenced by tide effects and water pressure indicated by T8a and T8b has
positive value in flood time from 29/7/2007 to 11/8/2007 with the flood alarm
of grad II. In other times the water pressure has negative value.
Figure 5b reflects the
change of temperature in river side (T8a) and in land side (T8b) of dike body
from 24/3/2006 to 25/10/2007. The temperature graphics increases to maximum
(27.5o C) in October 2006, after that it decreases to minimum (24.8o
C) in April 2007.
The data measured by T8a
and T8b from 07/12/2008 to 23/7/2008 have similar results.
3. Results of measurement
by FDR sensor system
Figure
6a presents monitoring results measured by FDR 8 sensors system in water side
and graphics of river water and groundwater levels. The extremes in water level
graphics correspond to flooding days of 2008 showed in Table 1.
The
curves of FDR 8 sensors reflect the change of dike soil permeability order
water saturation in different depths. Strong changes belong to the soil layer
in the depth of 0.95 m and 1.55 m. During high water time the water saturation
varies from 0.045 to 0.063 S/m.
Figure
6b shows progresses of soil permeability in land side measured by FDR 6 sensors.
In land side the soil layers have permeability smaller than in river side,
these values change from 0.025 to 2.42 S/m.
The
comparison of permeability variations
at two dike sides is showed in Figure
6c. Data received in the same depth (1.05 and 1.07 m), soil permeability
at river side has value greater than that at land side (at river side: 0.063
S/m; at land side: 0.037 S/m).
In brief, the FDR sensor
systems allow to measure automatically the change of dike material
permeability. These data are useful for dike management.
|
Figure 4. Resistivity
images of dike cross section measured from 08/7/2009
to 05/11/2009 and these changes
compared with normal resistivity section in %.
|
|
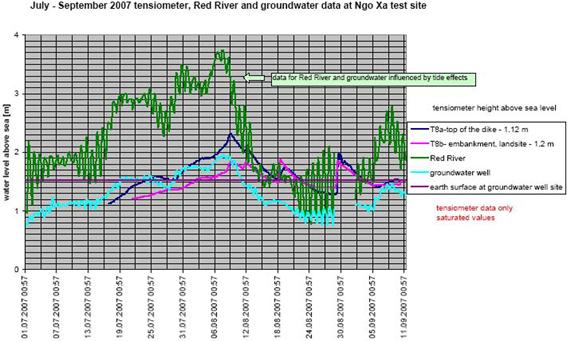
Figure 5a. Results
of measurement by tensiometer T 8
system
from 01/7/2007 to 11/9/2007.
|
|
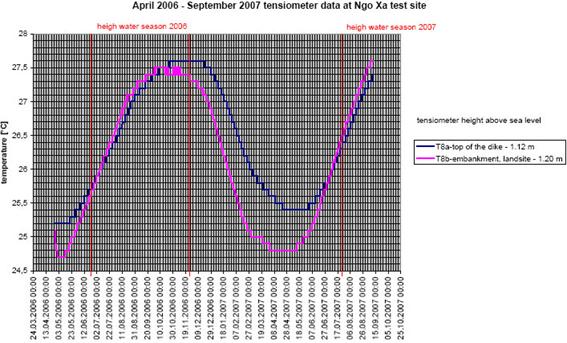
Figure 5b. Temperature changes of dike body from
24/3/2006 to 25/10/2007.
|
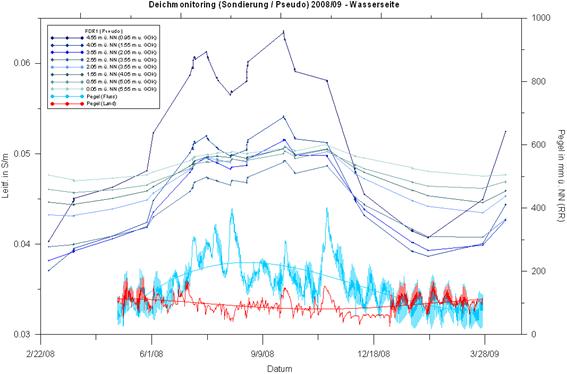
Figure 6a. Permeability variations of dike soil measured
by FDR 8 sensors at river side and the changes of river and ground water levels
from 22/02/2008 to 15/4/2009.
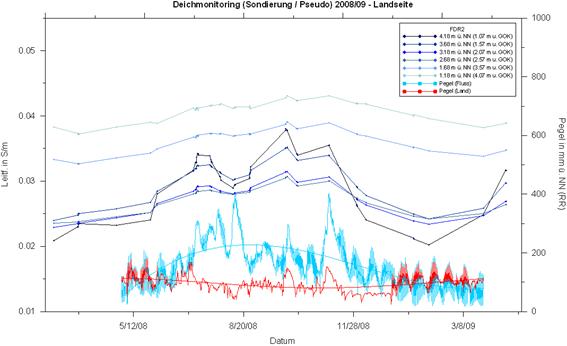
Figure 6b. Permeability variations of dike soil
measured by FDR 6 sensors at land side and the changes of river water and groundwater
levels from 22/02/2008 to 15/4/2009.
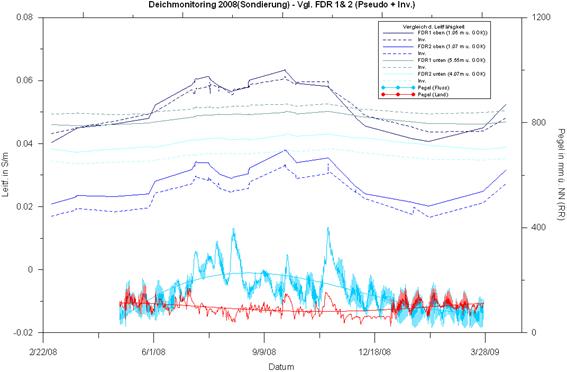
Figure 6c. Comparison
of permeability variations at two dike sides.
Table 1. Flood date of
2008 year
|
No
|
Date
|
Month,
year
|
River
water level (m)
|
|
1
|
17 - 26
|
7/2007
|
2.43 - 2.48
|
|
2
|
30/7 - 9/8
|
7 & 8/2007
|
2.83 - 3.04
|
|
|
|
|
|
|
1
|
7, 8, 9, 10, 11
|
7/2008
|
2.60 - 3.00
|
|
2
|
26, 27, 28, 29
|
7/2008
|
2.80 - 3.34
|
|
3
|
10,11,12,13,14,15
|
8/2008
|
2.50 - 3.70
|
|
4
|
25, 26, 27, 28, 29, 30
|
9/2008
|
1.80 - 2.50
|
|
5
|
1, 2, ...., 10, 11
|
11/2008
|
2.50 - 3.97
|
IV. CONCLUSIONS
For the first time a dike
monitoring system is installed at main points of weak dike section of the Red
River left dike in Thái
Bình Province.
In nearly 3 experimental years, this system has worked continuously under
tropical conditions (strong rain, high humidity, high temperature…). The system
has been repaired some time and the instruments have been improved
corresponding with Vietnamese conditions.
The analysis of monitoring data
in flood seasons 2006-2009 years has been carried out in first step. The above
initial results indicate that the monitoring system with new technologies and
instruments can provide with changes of dike body in flood season.
The combined analysis of data
and modelling in order to evaluate dike safety and to warn disaster events are
tasks in the coming time.
Acknowledgements: The joint project “Development of a dike monitoring system” is sponsored
by BMBF, Germany, VNM 05/001 and by MOST, Việt Nam, 42/823/2007/HD-NDT.
The authors would like to thank the leaders and managers of national and local
organs for useful assistance in the realization of this Project.
REFERENCES
1. Canh
Tr., A. Weller, 1995. Co-project report “Application of geophysical methods
to study on dike in Việt Nam”.
Sponsored by Volkswagen-Stiftung,
Germany, Archives of
DDG GmbH Leipzig,
Gemany and Inst. of Geol. Sci., Hà Nội.
2. Canh Tr., A. Weller, 2003. Final
report of Co-project “Development of a geo- electrical technology to find
termite nests for protecting dikes”. Sponsored by Volkswagen-Stiftung, Germany.
Archives of Inst. of Geophysics, TU Clausthal,
Germany and
Inst. of Geol. Sci., Hà Nội.
3. Cánh Tr., Tuyên D.V., Weller A., Preusse S., Vũ N.T., 2003. Application study of multi-electrodes geoelectrical
technology for finding hidden defects at dike in Thái Bình. Proc. of
Vietnamese-German Worksh. on Dike Monitoring, p. 47-53. Hà Nội.
4. Cánh Tr., Ph.K. Vân et al, 2007. The dike monitoring system as
a tool to protect actively against floods. Proc.
of 5th Symp. on geophysical sciences and technics of Việt Nam, Hồ
Chí Minh City.
5. Hennig Th., Weller A., Tr. Cánh, 2005. The effect of dike geometry on different resistivity
configuration. J. of Applied Geophysics,
57 : 278-292.
6. Report on assessment of quality of dike
and sluice buildings before storm: flood season year 2003. Archives of
National Dike Management Office. Hà Nội.
7. Sentek technologies, 2006. EnvirScanPlus, continuous
moisture monitoring solutions. www.sentek.com.au.
8. Tensiometer for direct measurement of
soil water tension, 2006. UMS GmbH,
Grmunder Str. 37, Muenchen,
Germany.
9. Tuyen
D.V., Canh T., Weller A., 2000. Geophysical investigations on river dike in
Việt Nam.
Euro. J. of Env. and Eng.
Geophysics. 4/3 : 195-206.
10. Weller
A., Hennig Th., Canh T., 2003. Topographic correction for dike
geometryusing averaged three-electrode configurations. Proc. of
Vietnamese-German Worksh. on Dike Monitoring, p. 31-36. Hà Nội.
11. Weller A., Tr. Canh, Ng.Tr. Vu, 2006. Multi-electrode measurements at Thái Bình dike (Việt
Nam).
Near surface Geophysics, 4/2.
12. 4 Point light 10 w. Technical data,
operating instruction. Version 4.19,
2008, LGM Lippman. Germany,
www.l-gm.de