HOUSE
TYPES AS INDICATOR OF HOUSEHOLD WELFARE, DOMESTIC WATER SUPPLY AND SANITATION
IN A CRAFT VILLAGE
IN NHUỆ-ĐÁY
RIVER BASIN
S. GROTHE1, R. EMMERICH1, W. STEINGRUBE1,
J. KASBOHM1&2, P. KRASKA3
1 Institute of Geography, University of
Greifswald, Makarenkostraße 22, 17487 Greifswald, Germany
2 GeoENcon Ltd., TZ Vorpommern, Brandteichstr. 20, 17489 Greifswald, Germany
3 Architect, Thomas-Müntzer-Platz 57, 18057 Rostock, Germany
Abstract: The
present study examines 3 house types for differences in welfare, domestic water
supply and sanitation of households in a craft village situated in the Nhuệ-Đáy
river basin. Extensive and time-consuming microdata surveys are needed to
procure household data, which are necessary for sophisticated municipal water
management planning on communal level. Findings of this study show that house
types contain useful informational values concerning the socio-economic
situation and the state of household based water supply and sanitation. It was
figured out that permanent housing units with all basic facilities (type A) and
semi-permanent housing units (type C) differ substantially according key
parameters. Permanent housing units without all basic facilities (type B)
reflect a transitional state of household living standard. Type A houses
accommodate households with significantly higher income. Remarkably higher
shares of municipal tap water connections and flushing toilets in house type A
cause a significantly higher tap water consumption compared to households
residing in both other house types. In house type B and especially in house
type C local water sources and dry toilets are widespread.
I. INTRODUCTION
Microdata on socio-economic situation, water
supply and sanitation are a cornerstone of municipal water management.
Considering the low capacities of local administration in Việt Nam, simplified
household data collection is expected to improve rural water supply and
sanitation management and planning. The approach of the present study therefore
is to examine housing structures for their informational value on household
welfare and the state of domestic water supply and sanitation. The outcomes of
the study are thought to facilitate an enhanced municipal water management
planning on communal level.
The terms “household” and “house” are frequently
regarded synonymously, as dwellings usually accommodate households. For
anthropologists a household is “the basic residential unit in which economic
production, consumption, inheritance, child rearing, and shelter are organized
and carried out” [6]. From the economic point of view the household can be seen
as a resource system or income-pooling system of people living in the same
residence [12, 15, 16, 18]. It was Levi-Strauss [7] who defined the “house” as
“a corporate body holding an estate made up of both material and immaterial
wealth which perpetuates itself through the transmission of its name, its
goods, and its titles down a real or imaginary line”. Scholars, despite
criticisms, have continued to employ a “house” centred focus in the study of
social organisation. Especially in regions like Southeast
Asia cognatic kinship principles are frequent; Levi-Strauss”
vision of “house based societies” is recognised as an indigenous referent for a
socio-residential unit [3, 10, 11, 17]. More recently the state of housing was
revealed as useful indicator of household poverty in Chinese cities [19]. Ya
Ping Wang [19] sees a strong connection between household income, housing, and
poverty. The same relationship was shown for post-reformation developments of
economy, society, and housing in Việt Nam (see [13]).
Housing policies in Việt Nam changed completely after the
implementation of Đổi Mới reforms in 1986. Pushed by further
economic reforms in 1992 people built new houses or improved their existing
houses. Socio-economic changes mixed up with cultural, lifestyle and
behavioural changes made the household an especially important economic unit.
The improvement of the housing condition has been tightly linked with economic development,
occupational orientation, and income generation. Poor households have little or
no chances to improve their housing condition. High-income households spend
more money on housing conditions than poor dwellers. Households with exclusive
use of basic facilities (toilet, kitchen, and bath) tend to have higher incomes
[13]. Bennett [1] presents domestic water demand as a function of the way water
is transported to the household and the number and kinds of plumbed appliances
in the house. Thus a linkage between household welfare, housing and domestic
water consumption seems likely.
This article presents the results of a household
survey conducted in a handicraft village located in the Nhuệ-Đáy river
basin. Taking the above described findings up this study aims to evaluate house
types as indicators for household welfare and the state of domestic water
supply and sanitation.
II.
CLASSIFICATION OF HOUSING UNITS
Information on housing
conditions has been gathered in Vietnamese population censuses since 1989. When
designing the census in Việt Nam, United Nations (UN)
recommendations on population and housing census have been consulted [8].
Accordingly, the General Statistics Office (GSO) of Việt Nam classified
3 house types for the 19891 and 4 house types for the 1999 census
respectively (Table 1).
Table 1. House types
distinguished during 1999 household census in Việt Nam [8].
|
Type 1
Permanent
|
Villas, multi-story houses, apartments of multi-storey buildings,
multi-floor buildings assembled from pre-fabricated components, brick
constructions with flat concrete roofs.
|
|
Type 2
Semi-permanent
|
Houses with walls made of brick/wood/wood frame and with roof made of
tile/cement-mortar roofing/metal roofing etc., houses constructed of
equivalent materials.
|
|
Type 3
House with durable frame and leaf-roof
|
Houses with frame made of wood (all area of roof is propped up by
durable pillars), with roof made of leaf/bamboo/oil-paper and its duration of
use is more than 15 years.
|
|
Type 4
Simple
|
Houses of simple composition and primitive materials; walls are not built
of bricks or wooden frame; roof of bamboo/leaf/oil-paper etc.
|
¯¯¯¯¯¯¯¯¯¯¯¯¯¯¯¯¯¯¯¯¯¯¯¯¯¯¯¯¯¯¯¯
1Permanent
houses, semi-permanent houses, and simple houses
The housing classification used by the GSO changes frequently and
differs between household census and Việt Nam Living Standard Survey
(VLSS). During the 2002 survey2 5 house types3 were
distinguished. However, for the 20044 and 2006 (GSO, 2007) surveys
the GSO reverted to permanent, semi-permanent, and simple houses as applied in
the 1989 census. This adjustment process shows that a general housing
classification, adapted to Việt Nam and concerned problems, has not
yet been found.
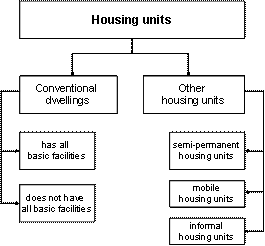
Figure 1. Housing units according to UN
recommendations [14].
The UN recommendations distinguish between conventional dwellings and
other housing units (Fig. 1). A conventional dwelling is intended for
habitation by one household. It is a room or suite of rooms in a permanent
building. This structure, as distinguished from semi-permanent housing units,
is expected to maintain its stability for 15 years or more, depending on the
national definition of durability. Conventional dwellings are separated into 2
types taking into account the equipment with piped water, toilet, bath, and
kitchen [14].
III. METHODS AND
MATERIALS
In spring 2007 a household survey was conducted in Tòng Xá
village (Nam
Định province). Interviews were held in 320 households. Socio-economic
data and information about domestic water supply and sanitation were gained
from heads of the particular household. For October 2006 and March 2007 tap
water consumption data of supplied households in Tòng Xá was obtained.
The data was delivered by the Ý Yên Water Supply Company. For a
profound overview about the study area, see Nguyễn Thanh Lan et al. [9].
Subsequent to an initial observation of the housing situation in
Tòng Xá, house types were classified on the basis of UN recommendations
[14] and the GSO system as presented by Mai Van Cam and Chu Thi Loan [8]. The
characterization considered storey number, building materials, location of
basic facilities (kitchen, bathroom, toilet), and building design. Accordingly,
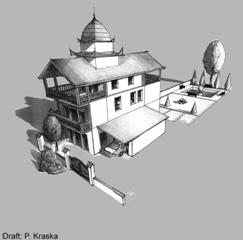
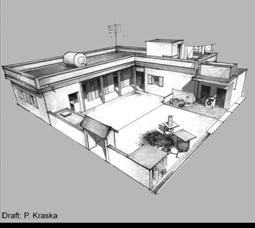
house types A and B comprise permanent buildings. Type A dwellings are always
equipped with all basic facilities whereas this is not obligatory for houses of
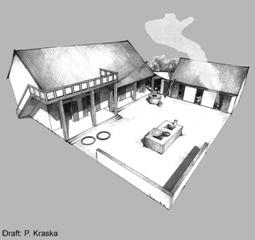
type B. Type C dwellings are semi-permanent buildings without basic facilities
inside the house (Box 1). Simple houses or dwellings solely made of wood and
bamboo were not found in Tòng Xá. Information about the house type was
gathered for dwellings of all interviewed households. The collected data was
processed with SPSS statistical software.
¯¯¯¯¯¯¯¯¯¯¯¯¯¯¯¯¯¯¯¯¯¯¯¯¯¯¯¯¯¯¯¯
2Living Standard Survey 2002, GSO, www.gso.gov.vn/default_en.aspx?tabid=483&idmid=4&ItemID=1843,
retrieved 10th August 2009.
3City
house, permanent house with private bathroom, toilet, and kitchen, permanent
house without private bathroom, toilet, and kitchen, semi-permanent house, and
simple or other houses.
4Living
Standard Survey 2004, GSO, www.gso.gov.vn/default_en.aspx?tabid=483&idmid=4&ItemID=4343,
retrieved 10th August 2009.
Box 1. House
types in Tòng Xá based on GSO system und UN recommendations (see: [8, 14]).
|
House type A
Permanent
Kitchen, bathroom, toilet always inside the
dwelling
|
|
|
House type B
Permanent
Kitchen, bathroom, toilet partly outside the
dwelling
|
|
|
House type C
Semi-permanent
Kitchen, bathroom, toilet always outside the
dwelling
|
|
IV. RESULTS AND
DISCUSSION
1. Socio-economic
situation of households in Tòng Xá village
The study revealed a diversified income structure of households in
Tòng Xá. In average each household has 5 members and the mean area
covered per household is 269.71 m². However, a cogent relationship between
the area of households and the welfare of dwellers was not proved. The income
structure of Tòng Xá shows characteristics of a craft and trade village:
only 45.5% of inhabitants earn their main income from agriculture (Tab. 1). The
mean income of farmers is below poverty line.5 There are several
households that have additional income sources. Home based handicraft (wood
working and food processing) and pig breeding are common sideline bases. Unlike
earnings from agriculture, household based craft activities offer a more
profitable, permanent and stable income. Thus the planning reliability for
Table 1. Main
income source, mean income in 1,000 VND (N = 270) of households (N = 319), and
income quintiles in Tòng Xá, 2007.
|
Income source / Income quintile
|
%
|
Mean income per
capita/month
|
|
Agriculture
|
45.5
|
158.36
|
|
Salary
|
28.2
|
555.77
|
|
Craft and trade
|
23.2
|
2,461.33
|
|
Pension
|
3.1
|
631.98
|
|
Total
|
100
|
871.92
|
|
1 “poorest”
|
20
|
94.61
|
|
2 “near poorest”
|
20
|
174.55
|
|
3 “medium”
|
20
|
253.81
|
|
4 “near richest”
|
20
|
404.82
|
|
5 “richest”
|
20
|
3,531.77
|
expenditures is increased. However, when a domestic business
activity generates more income than farming, it is considered the main income
source. Most notable craft and trade activities are metal working as foundry
and lathing (38% of businesses), service (31%), and wood working (25.4%).
Especially metal working ensures a high income and a large number of jobs.
Salaries in casting companies as also earnings from private business offer
significantly higher income than agriculture. Moreover, medium sized metal
working generates well paid jobs in trade services. Nevertheless, social
disparities are intensified by industrialisation
¯¯¯¯¯¯¯¯¯¯¯¯¯¯¯¯¯¯¯¯¯¯¯¯¯¯¯¯¯¯¯¯
5 200,000
VND per capita and day according to Decision 170/2005/QD-TTg, General
Statistics Office (GSO) of Việt Nam, retrieved from:
www.gso.gov.vn/default_en.aspx?tabid=462&idmid=2&ItemID=2948,
18 July 2009.
Processes in the village. For Tòng Xá the
difference between income quintile 5 (richest) and income quintile 1 (poorest)
is 37.33. For comparison, in 2006 the same ratio for Nam Định province
was only 5.42 (GSO, 2007).
2. Housing
structures and household welfare
According to the study, in
Tòng Xá the majority of residents live in type B and C dwellings, only
13% of interviewed households reside in house type A (Fig. 2). The mean number
of residents per house is 5 for each of the dwelling types. Differences in the
socio-economic situation of households are reflected by the housing structure.
The 3 house types display the spectrum of household welfare in the village
(Tab. 2). The strongest differences were found between type A and type C
dwellings. The differences in household welfare indicated by house types B and
C are considerably weaker (Tab. 3). The mean income of households living in
type A dwellings is significantly higher than earnings of households living in
house type B or C. Among residents of type A dwellings, tradesman is the most
frequent occupation. Farmers are predominant residents of house types B and C.
Employees which work mainly for one of the casting companies in the nearby
industrial zone account for about 30% of residents in dwellings of each type.
Traditional household based economic activities (e.g. pig breeding, wood
working) are performed by households living in type B and C dwellings in equal
shares. However, these inefficient domestic businesses are irrelevant to
residents living in house type A.
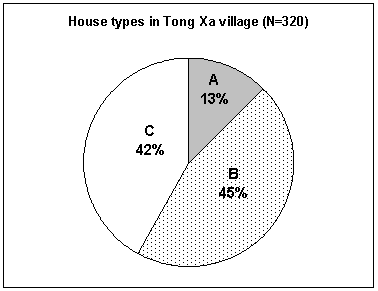
Figure 2. Distribution of house
types among interviewed households (N=320)
in Tòng Xá, 2007.
Table 2. Descriptive
statistics of household welfare for house types in Tòng Xá, 2007.
|
Dependent variable
|
Parameter
|
House type A
|
House type B
|
House type C
|
|
Main
income source
|
N valid
|
39
|
146
|
134
|
|
Agriculture
|
yes = 1
|
7.7%
|
41.1%
|
61.2%
|
|
Salary
|
yes = 1
|
33.3%
|
27.4%
|
27.6%
|
|
Craft and
trade
|
yes = 1
|
53.8%
|
29.5%
|
7.5%
|
|
Household
business
|
N valid
|
40
|
146
|
134
|
|
Pig
breeding
|
yes = 1
|
2.5%
|
41.1%
|
43.3%
|
|
Wood
processing
|
yes = 1
|
0%
|
9.6%
|
11.2%
|
|
Metal
working
|
yes = 1
|
32.5%
|
9.6%
|
0%
|
|
Household
income
|
N valid
|
35
|
131
|
104
|
|
Mean
income
(1,000
VND/capita/month)
|
Mean
|
4,240.04
|
461.35
|
255.58
|
|
Stand. Dev.
|
8,480.33
|
1,189.0
|
198.26
|
|
Min
|
143
|
22
|
50
|
|
Max
|
35,417
|
12,600
|
1,100
|
Table 3. Pair-wise tests of
house types on independence and strength of relationship regarding household
welfare.
|
Dependent variable
|
Sample
|
Test parameter
|
|
Main income source
|
House type
|
Pearson χ²
|
Phi
|
|
Agriculture
|
A
|
B
|
15.292**
|
-0.288**
|
|
A
|
C
|
34.598**
|
-0.447**
|
|
B
|
C
|
11.292**
|
-0.201**
|
|
Salary
|
A
|
B
|
0.531
|
0.054
|
|
A
|
C
|
0.481
|
0.053
|
|
B
|
C
|
0.002
|
-0.002
|
|
Craft and trade
|
A
|
B
|
8.095**
|
0.209**
|
|
A
|
C
|
44.187**
|
0.505**
|
|
B
|
C
|
22.016**
|
0.280**
|
|
Household business
|
House type
|
Pearson χ²
|
Phi
|
|
Pig breeding
|
A
|
B
|
21.221**
|
-0.338**
|
|
A
|
C
|
22.863**
|
-0.362**
|
|
B
|
C
|
0.137
|
-0.022
|
|
Wood processing
|
A
|
B
|
4.148**
|
-0.149**
|
|
A
|
C
|
4.900**
|
-0.168**
|
|
B
|
C
|
0.194
|
-0.026
|
|
Metal working
|
A
|
B
|
13.282**
|
0.267**
|
|
A
|
C
|
47.066**
|
0.520**
|
|
B
|
C
|
13.526**
|
0.220**
|
|
Household income
|
House type
|
Mann-Whitney U
|
Z
|
|
Mean income
(1,000 VND/capita/month)
|
A
|
B
|
868.0**
|
-5.644
|
|
A
|
C
|
467.5**
|
-6.571
|
|
B
|
C
|
5,801.0
|
-1.955
|
** Significant at 0.05 level
3. Household based
water supply and sanitation in Tòng Xá village
Rainwater and well
water (dug and drilled) are traditionally used local water sources in
Tòng Xá. Since 2001 the village has been connected to a municipal tap
water supply. At the time of the survey 62.2% of 320 interviewed households had
a municipal tap water connection available. Nevertheless, 70.9% of the
interviewed households stated to use centrally supplied tap water. The
difference illustrates neighbourly help to households that cannot afford the
water connection. Recipients of the tap water fill up their rainwater cisterns
and pay an agreed price. This kind of unofficial tap water supply is found in
type C (14.2%) and type B dwellings (6.1%). All tap water users living in house
type A have a municipal tap water connection available.
¯¯¯¯¯¯¯¯¯¯¯¯¯¯¯¯¯¯¯¯¯¯¯¯¯¯¯¯¯¯¯¯
6 Outlier
adjusted
The mean tap
water consumption6 is 61.36 l/person/day. In terms of utilised water
sources dwellers were distinguished between: 1. Households using municipal tap
water only (17.8%); 2. Households using municipal tap water and local water
sources (45%); and 3. Households using local water sources only
(37.2%). The mean tap water consumption at households which exclusively use tap
water (85.73 l/person/day) is significantly higher than at households using
municipal tap water and local water sources (52.12 l/person/day).
Main types of
toilets in Tòng Xá are waterless pit latrines and flushing toilets.
These toilet types are distributed nearly equally. In 55.7% of households (N =
318) residents use a pour flush toilet, 43.4% of households are equipped with a
dry toilet. In 6 households both types of toilets are available. In 8
interviewed households (2.5% of N = 318) residents had no toilet. They were
using a bucket latrine, the pig hutch or the toilet of the neighbour.
4. Housing structures
and domestic water supply and sanitation
In Tòng Xá the state
of domestic water supply and sanitation is reflected by the house type. The
strongest differences were found between type A and type C dwellings (Tabs. 4
& 5). The supply degree of municipal tap water is highest for households
residing in type A housings. In such house types 47.5% of households
exclusively use public tap water, whereas only 2.5% are solely dependent to
local water sources. The supply degree of municipal tap water is decreased by
nearly 20% for type B dwellings and is lowest in house type C. In contrast, the
utilisation of local water sources (well water, rainwater) raises from house
type A to B and is highest in type C dwellings, in which 54.5% of households
use local water sources only.
Table 4. Descriptive
statistics of domestic water supply and sanitation for house types in Tòng Xá, 2007.
|
Dependent variable
|
Parameter
|
House
type A
|
House
type B
|
House
type C
|
|
Water supply / sources
|
N valid
|
40
|
146
|
134
|
|
Own public tap
|
yes
= 1
|
97.5%
|
69.2%
|
44.0%
|
|
Rainwater use
|
yes
= 1
|
45.0%
|
68.5%
|
82.1%
|
|
Private well
|
yes
= 1
|
22.5%
|
74.0%
|
81.3%
|
|
Public tap water use only
|
yes
= 1
|
47.5%
|
17.1%
|
9.7%
|
|
Local water sources use only
|
yes
= 1
|
2.5%
|
30.8%
|
54.5%
|
|
Water consumption
|
N
valid
|
27
|
84
|
49
|
|
Mean tap water consumption
(litres/person/day)
|
Mean
|
102.44
|
56.37
|
47.28
|
|
Stand.
Dev.
|
54.42
|
42.09
|
38.12
|
|
Min
|
0
|
0
|
0
|
|
Max
|
190.86
|
190.32
|
153.23
|
|
Sanitation
|
N
valid
|
40
|
145
|
133
|
|
Pour flush toilet
|
yes
= 1
|
100%
|
64.8%
|
32.3%
|
|
Dry toilets
|
yes
= 1
|
5%
|
34.5%
|
64.7%
|
Important differences
between house types A, B, and C in terms of water storage capacity were figured
out. Dwellers living in type A houses possess significantly larger storage
capacity (9.7 m³) compared to both other house types B (5.5 m³) and C
(4.5 m³). Residents living in type C dwellings have substantially lower
water storage capacity in comparison to households residing in the other house
types.
Table 5. Pair-wise tests of
house types on independence and strength of relationship regarding domestic
water supply and sanitation.
|
Dependent variable
|
Samples
|
Test
parameter
|
|
Water supply / sources
|
House type
|
Pearson χ²
|
Phi
|
|
Own public tap
|
A
|
B
|
13.530**
|
0.270**
|
|
A
|
C
|
35.801**
|
0.454**
|
|
B
|
C
|
18.044**
|
0.254**
|
|
Rainwater use
|
A
|
B
|
7.472**
|
-0.200**
|
|
A
|
C
|
21.790**
|
-0.354**
|
|
B
|
C
|
6.889**
|
-0.157**
|
|
Private well
|
A
|
B
|
35.649**
|
-0.438**
|
|
A
|
C
|
48.869**
|
-0.530**
|
|
B
|
C
|
2.177
|
-0.088
|
|
Public tap water only
|
A
|
B
|
16.042**
|
0.294**
|
|
A
|
C
|
29.324**
|
0.411**
|
|
B
|
C
|
3.281
|
0.108
|
|
Local water sources only
|
A
|
B
|
13.530**
|
-0.270**
|
|
A
|
C
|
34.050**
|
-0.442**
|
|
B
|
C
|
16.036**
|
-0.239**
|
|
Water consumption
|
House type
|
F
|
t
|
|
Mean tap water use
(litres/person/day)
|
A
|
B
|
5.751**
|
4.028**
|
|
A
|
C
|
8.488**
|
4.673**
|
|
B
|
C
|
0.589
|
1.243
|
|
Sanitation
|
House type
|
Pearson χ²
|
Phi
|
|
Pour flush toilet
|
A
|
B
|
19.424**
|
0.324**
|
|
A
|
C
|
56.418**
|
0.571**
|
|
B
|
C
|
29.309**
|
0.325**
|
|
Dry toilet
|
A
|
B
|
13.486**
|
-0.270**
|
|
A
|
C
|
43.797**
|
-0.503**
|
|
B
|
C
|
25.284**
|
-0.302**
|
** significant at
0.05 level
The mean tap
water consumption of households living in house type A is significantly higher
than in house types B and C. The tap water consumption of households in types B
and C dwellings are similar to Vietnamese planning figures for clean water
supply in rural areas (60 l/person/day).7 However, the water demand
of households residing in type A houses is close to consumptions reported for
the Vietnamese city Buôn Ma Thuột [2]. The increased demand indicates the
substitution of local water sources by centrally supplied tap water. The mean
tap water consumption is significantly higher at households having no well
water or rainwater available. According to Grothe et al. [4] also the use of flushing toilets causes increased tap
water consumption. Although the availability of private wells or rainwater and
municipal tap water are dependent to each other, no linkage between flushing
toilets and local water sources was found. However, the equipment of households
with flushing toilets depends on the availability of a tap water connection.
¯¯¯¯¯¯¯¯¯¯¯¯¯¯¯¯¯¯¯¯¯¯¯¯¯¯¯¯¯¯¯¯
7GoV (Government of Vietnam) (2006)
Sector Programme Support to Water, Sanitation and Hygiene Promotion, DANIDA,
June 2006, retrieved from www.danidadevforum.um.dk/NR/rdonlyres/0788AFEF-2A45-48F2-A538-1F16520D2B27/0/WSPS_II.pdf,
10 August 2009
Considerable differences
between house types were also revealed for the sanitary equipment of
households. All type A dwellings are provided with a pour flush toilet.
Remarkably, 5% of households residing in house type A had an additional dry
toilet available. In these 2 cases the grandparents refused to use the pour
flush toilet inside the house. Only 32.3% of households residing in house type
C possess a pour flush toilet, the traditional dry latrine is widespread
(64.7%). In house type C (4.5% of N = 133) and in house type B (1.4% of N =
145) households were found to have no toilet available.
V. CONCLUSIONS
The 3 examined house types are capable of indicating different degrees
of household welfare in Tòng Xá. The strongest differences were revealed
between permanent houses with all basic facilities (type A) and semi-permanent
houses (type C). Type A dwellings represent households with a significantly
higher welfare compared to households living in house type C. Residents living
in permanent houses without all basic facilities (type B) are in a transitional
state of living standard and welfare. However, households accommodated in type
B dwellings frequently show socio-economic characteristics similar to
households which reside in house type C.
The supply degree of municipal tap water, well water, rainwater, as well
as the availability of dry and flushing toilets can be indicated by house
types. All these parameters influence the tap water consumption. The demand on
municipal tap water increases from house type C to B and A. Thus house types
are suitable to distinguish the tap water consumption of households.
Nevertheless, the tap water demand of households which reside in house types B
and C does not differ significantly. House type A represents mean tap water
consumption at urban level, whereas type B and C houses comply with planning
figures of clean water demand for rural areas in Việt Nam.
As pointed out in the present study, it is reasonable to distinguish
between permanent buildings with all basic facilities and permanent buildings
without all basic facilities. Such segregation revealed remarkable differences
between households living in permanent houses. Also, it emphasised differences
between households that live in type A and C houses respectively. Due to the
relation between water consumption and the number of piped water supplies
inside the building, the provision with piped well water and rainwater supplies
to the house is considered a crucial parameter for future studies.
Acknowledgements: The study was
conducted in the frame of an IWRM project in Việt Nam financed by the
German Federal Ministry of Education and Research (BMBF: 02WM0765). All work in
Tòng Xá village was kindly supported by the Peoples Committee of
Yên Xá commune and Nam Định Provincial Department of Science and
Technology (DoST).
REFERENCES
1. Bennett S.,
2001. TA 2871-VIE Red River Basin water resource
management Project - Final report, land use. Water management study, ADB.
2. Cheesman J.,
J. Bennett, Tran Vo Hung Son, 2008. Estimating household
water demand using revealed and contingent behaviors: Evidence from Việt
Nam. Water Res. Research, 44 : 1-11.
3. Gillespie
Susan D., 2000. Lévi-Strauss: Maison et société, une maison.
In: R.A. Joyce, S.D. Gillespie. Beyond kinship: Social and material
reproduction in house societies. Univ.
of Pennsylvania Press, pp. 22-52.
4. Grothe S., R.
Emmerich, J. Kasbohm, 2009. Sustainable municipal
wastewater management for a craft village in Nhuệ-Đáy river basin. J. of Geology, B/34 : XX-YY. Hà Nội.
5. GSO (General
Statistics Office), 2007. Results of the Việt
Nam household living standard survey. Statistical
Publ. House, Hà Nội.
6. Haviland W.A.,
H.E.L. Prins, D. Walrath, B. McBride, 2009.
The Essence of Anthropology. Cengage
Learning, 379 pp.
7. Levi-Strauss
C., 1983. The way of the masks. Cape, London.
8. Mai Van Cam,
Chu Thi Loan, 2001. Harmonization of household
variable on housing conditions in the 1989 and 1999 population censuses of Việt
Nam. Population Center, Univ. of
Minnesota, Dept of History. Downloaded from: www.hist.umn.edu/~rmccaa/IPUMSI/Việt
Nam/vnhousing.doc, on: 2 March 2008.
9. Nguyen Thanh
Lan, Nguyen Thi Thu Thuy, W. Steingrube, 2007. Review
of socio-economic situation and spatial development planning by local
authorities in Yên Xá commune, Ý Yên district, Nam Định
province, Việt Nam. J. of Geology,
B/29 : 76-84. Hà Nội.
10. Schrauwers
A., 2004. Houses, estates and class: On the importance
of capitals in Central Sulawesi. In: Bijdragen tot de Taal-, Land- en Volkenkunde,
160 : 71-93.
11. Sparkes S.,
S. Howell, 2003. The house in Southeast
Asia: A changing social, economic and political domain. Routledge, 271 pp.
12. O’Sullivan
A., S.M. Sheffrin, 2004. Economics: Principles in
action. Pearson Prentice Hall.
13. Trinh Duy
Luan, Nguyen Quanh Vinh, B. Wiesman, M. Leaf, 2000.
Urban housing. In: P. Bootthroyd, Pham
Xuan Nam (Eds.). Socio-economic
renovation in Vietnam - the origin, evolution, and impact of Doi Moi. Inst. of SE Asian Studies, Singapore, pp.
51-100.
14. United
Nations, 2007. Principles and recommendations for population
and housing censures. UN, New York, 507
pp..
15. Vu Tuan Anh,
Tran Thi Van Anh, Terry G. McGee, 2000.
Household economy. In: P. Bootthroyd,
Pham Xuan Nam (Eds.). Socio-economic
renovation in Việt Nam - the origin, evolution, and impact of Doi Moi.
Inst. of SE Asian Studies, Singapore, pp.
101-138.
16. Wallerstein
I., 1984. Household structures and labour-force formation
in the capitalist economy. In: J. Smith,
I. Wallerstein, H.D. Evers (Eds.). Households
and the world economy, Sage, Beverly
Hills, pp. 17-22.
17. Waterson R.,
1995. Houses and hierarchies in island Southeast
Asia. In: J. Carsten, S. Hugh-Jones (Eds.).
About the house: Lévi-Strauss and beyond.
Cambridge Univ. Press, pp. 47-68.
18. Wood C.H.,
1981. Structural changes and household strategies:
A conceptual framework for the study of rural-urban Migration. In: Human
Organization, 40 : 338-344.
19. Ya Ping Wang, 2004. Urban poverty, housing
and social change in China. Routledge,
182 pp..