RESISTIVITY
IMAGING MEASUREMENTS IN
NGUYỄN
TRỌNG VŨ1,3,
TĂNG ĐÌNH NAM2, ANDREAS WELLER3
1 Institute of Geophysics, VAST,18 Hoàng Quốc Việt, Hà Nội
2 Institute of Geosciences and Mineral Resources, Thanh Xuân, Hà Nội
3 Institute of Geophysics, Clausthal University of Technology,
Arnold-Sommerfeld-Str. 1, D-38678 Clausthal-Zellerfeld, Germany
Abstract: This
paper presents new results of resistivity imaging along two profiles in Xuân
Trường and Giao Thủy districts,
I. INTRODUCTION
II. HYDROGEOLOGICAL
SITUATION
In the
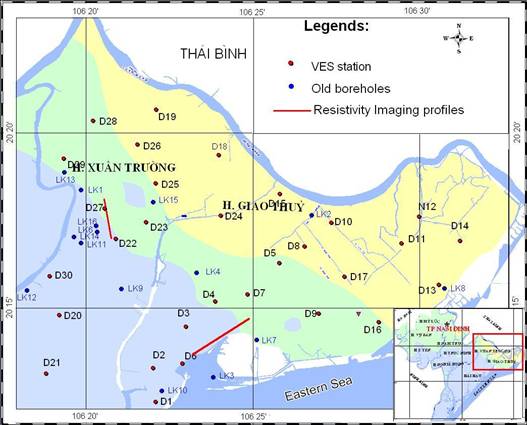
According to Đoàn Văn Cánh et al. [1] and Nguyễn Văn Độ et al. [3], brackish water intrudes in almost all Holocene aquifers. For the Pleistocene aquifer, freshwater lenses only exist in Hải Hậu, Nghĩa Hưng and a part of Giao Thủy and Xuân Trường districts. That means that the boundary between fresh and saline groundwater in Pleistocene is located in the areas of Giao Thủy and Xuân Trường districts. In Figure 1, the studied area is divided into three colour zones corresponding to the Total Dissolved Solid (TDS) value ranges. The blue, green, and yellow colour areas correspond to the TDS value below 1 g/l, in range 1-3 m/l, and over 3 m/l. Two profiles of Resistivity Imaging were carried out to determine the geological structure and to delineate the aquifers in this area (Fig. 1).
III. RESISTIVITY
IMAGING MEASUREMENTS
To map the resistivity distribution of a vertical section, the
Resistivity Imaging (RI) measurements using non-polarization electrodes were carried
out. The two RI profiles have a total length of 4230 m. The minimum electrode
distance is 20 m and its maximum is 160 m. The data were acquired by a Sintrex
system (made in
IV. RESULTS AND
DISCUSSION
1. Data
interpretation
The RI data were inverted by RES2DINV and DC2DSIRT programs to determine the resistivity distribution of 2D vertical cross-sections. The RES2DINV software yields higher contrasts in the resistivity section, while the DC2DSIRT results in smoother images. The RES2DINV enables the location of small anomalies, while DC2DSIRT better reflects gradual changes in resistivity. The non-commercial DC2DSIRT software uses predetermined parameters for the inversion process. A lot of parameters are adjustable in the RES2DINV software.
We separated the RI data file into two different data sets. The first data set includes only the data levels with an electrode spacing of 20, 40 and 80 m (without 160 m level). It corresponds to a maximum depth of investigation of 115 m. The second data set includes all data (with electrode spacing 20, 40, 80 and 160 m). The resulting section shows the resistivity distribution down to a depth of 210 m.
2. Xuân Trường
profile
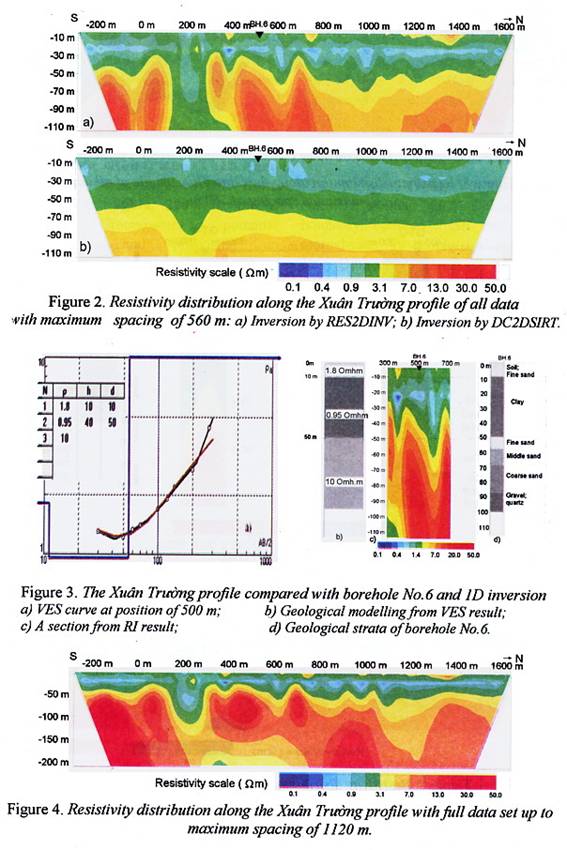
The Xuân Trường profile has a total length of 1930 m. It is located in Xuan Tien and Xuan Hung communes. Figure 2 shows the resistivity distribution of profile using the first data set. The section presented in Figure 2a is inverted by RES2DINV. It shows higher contrasts in the resistivity distribution compared with the section in Figure 2b which is inverted by DC2DSIRT and represents a smoother image. Both resistivity sections reveal a layered structure. The first layer, from the surface to 50 m depth, is characterized by low resistivity around 1-5 Ωm corresponding to Holocene aquifers. The deeper layer reaching down to 100 m with resistivity in the range from 5 to 50 Ωm corresponds to the Pleistocene aquifer. Along the Xuân Trường profile, a low resistivity anomaly can be observed around the position of 200 m. The second layer seems to be interrupted. It remains questionable whether a connection between the Holocene and Pleistocene aquifers exists. This question can only be solved by further investigations.
Figure 3 shows a section of Xuân Trường profile which is compared with borehole No. 6 and the result of a 1D inversion of a Vertical Electrical Sounding (VES) [4]. The curve of the VES at the position of 500 m is displayed in Figure 3a. Following the result of inversion, the model includes three layers with resistivities of 1.8, 0.95, and 10 Ωm (Fig. 3b). The section from 300 to 500 m of the resulting model of RI is presented in Figure 3c. Figure 3d shows the layered lithological structure according to the observations in the borehole No. 6 which is located in a distance of 200 m from the profile (at position 500 m of profile). We can recognize a good agreement between the resistivity distribution of 2D section and the layering in the borehole and the inversion of the VES. Following the comparison, the formations with a resistivity of below 1 Ωm should be classified as clayey layer. The resistivity from 1-5 Ωm is related to soil and a layer consisting of fine sand. The resistivity above 5 Ωm refers to sand and gravel layer. The aquifers with a resistivity of over 5 Ωm can be regarded as fresh groundwater-bearing formations.
The inverted resistivity section along the Xuân Trường profile, which considers the complete data set, is displayed in Figure 4. We recognize the conductive anomaly at the position around 200 m that looks like a fracture zone or a hydrogeological window.
3. Giao Thủy
profile
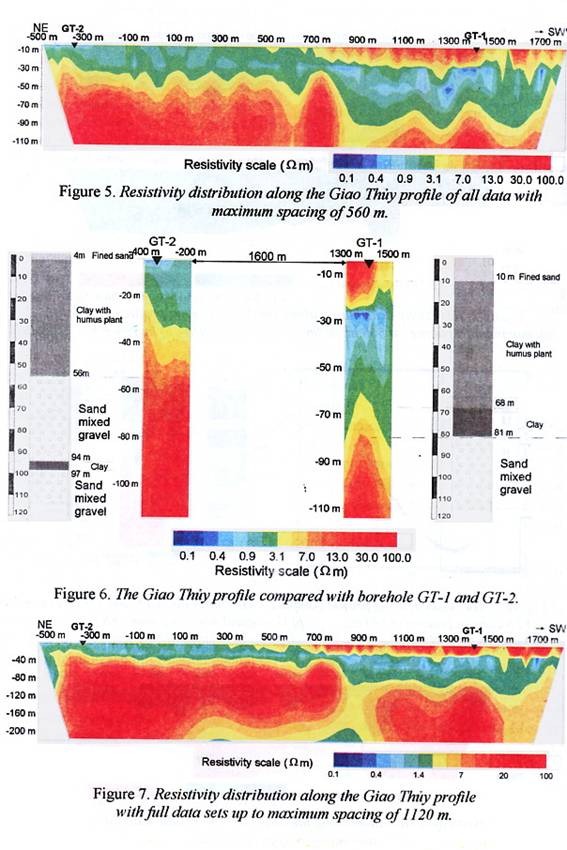
The Giao Thủy profile was interpreted in the same way. It has a total length of 2350 m. Figure 5 displays the inverted resistivity section along this profile up to a depth of 110 m. The resistivity distribution along the profile reflects the geological structure. Following the resistivity distribution, we can conclude that fresh groundwater mainly exists in Pleistocene aquifers. Higher resistivity values at small depth in the interval of from 700 m to the southwestern end of the profile indicate the presence of fresh-water in the Holocene aquifer.
To verify the RI results, two wells were drilled at the position -350 m (well GT-2) and 1400 m (well GT-1) of profile with a depth of 115 m. In Figure 6, two narrow sections of the Giao Thủy profile are compared with the bedding observed in the two boreholes. The results of RI well conform to the information obtaining from the boreholes. The TDS values measured in the boreholes in the Pleistocene aquifer are 0.8 g/l in GT-1 and 0.6 g/l in GT-2. These values prove that the aquifer contains fresh groundwater. This result conforms to the higher resistivities observed along RI profile at a depth of below 90 m.
The inversion of the full data set presents the resistivity distribution along the profile down to a depth of 210 m (Fig. 7). Since the resistivity section reflects the geological structures along the profile a fracture zone may be expected around 850 m where a significant change in the resistivity distribution can be recognized (see also Fig. 5).
V. CONCLUSIONS
Resistivity Imaging has been proving to be an appropriate tool to investigate hydrogeological structures in coastal areas. The resulting resistivity sections provide promising 2D images of geological structures. Regarding the resistivity values, fresh water-bearing areas can be identified in Holocene aquifers. A fresh groundwater-bearing formation corresponds to a resistivity of over 5 Ωm. The resistivity sections reveal vertical low resistivity structures which may be related to hydogeological windows or fractures zones.
1. Đoàn Văn Cánh, Lê Thị Lài, Hoàng Văn Hùng, Nguyễn
Đức Rỡi, Nguyễn Văn Nghĩa, 2005. Groundwater
potential of
2. Lê Thị Lài,
Đoàn Văn Cánh, Nguyễn Đức Rỡi, Phạm Thái
Nam, Phạm Quý Nhân, Nguyễn Đức Bình, Nguyễn Văn Nghĩa, 2004. Report of Project “Groundwater
potential investigations and proposing an appropriated method for groundwater
exploitation to protect groundwater resources in
3. Nguyễn Văn Độ, Tạ Đức Bốn,
Đỗ Văn Quốc, Bùi Minh Đức, 1996.
Explanatory note to the hydrogeological map of
4. Nguyễn Trọng Vũ, Tăng Đình