|
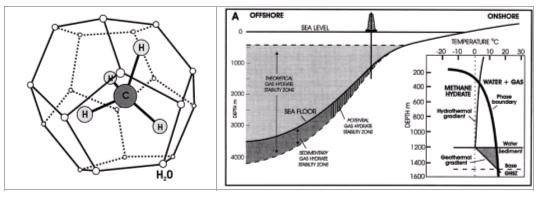
Figure 1. Gas hydrate compound
[1]. |
Figure 2. The GHSZ inserts
depicting the pressure and temperature profile in well [1]. |
APPLICATION OF
POSTSTACK DECONVOLUTION
FOR THE GAS HYDRATE SEISMIC REFLECTION DATA
2D.H. HIEN, 1S. JANG, 1Y.
KIM, 1S. SUH
1Seismic Data
Processing Team, Korea Institute of Geosciences and Mineral Resources
2University of Science and
Abstract: Deconvolution is one of the most used techniques for processing seismic
reflection data. It is applied to improve temporal resolution by wavelet
shaping and removal of short period reverberations. Several deconvolution
algorithms, such as predictive, spike, minimum entropy deconvolution and so on,
have been proposed to obtain such above purposes. Among them, l1
norm inversion deconvolution has given advantages to invert the seismic
reflectivity, acoustic impedance and enhance the seismic signal. Theoretically,
deconvolution can be considered as an inversion technique that inverts the
single seismic trace to the reflectivity of the subsurface, but it has not been
successfully adopted due to noisy signals of the real data set. After stacking,
we can get the subsurface image whose seismic traces are moved to the zero
offset, thus each of them now can be a single trace that is created by
convolving the seismic source wavelet and reflectivity. So that, the single
stacked trace can be deconvolved to get the reflectivity then gather up to get
the full image of reflectivity.
In this paper, the fundamental of l1 norm inversion
deconvolution method will be introduced. The method will be tested by synthetic
data, then applied for Korean offshore seismic data set for gas hydrate
exploration. The result of poststack deconvolution not only shows that the
stacked image of subsurface has been improved by removing multiples but also
gives a good estimation of seismic reflectivity and acoustic impedance for
further analysis of bottom simulating reflector (BSR) location .
I. INTRODUCTION
Deconvolution
in seismic data processing is one of the methods enhancing the signal by
removing the multiples. Furthermore, the deconvolution is also an inversion
technique recovering the seismic reflectivity, which is considered as one of
seismic attribute. With the knowing of reflectivity, the direct estimation of
lithology and pore fluid is possible, that is very significant to the oil and
gas exploration in general, and gas hydrate exploration in particular.
Gas hydrate is
solid like substances naturally occurring at the bottom of ocean or in the
polar areas. It contains vast, unstable reserves of methane and other natural
gases. Many believe that, if released in the environments, the methane from gas
hydrate would be considerable hazards to marine ecosystem, coastal population
or worse, that would dangerously contribute to the global warming. On the other
hand, gas hydrate contains enough natural gas to provide and energy supply to
the XXI century [1]. Gas hydrate study in Ulleung basin has been established
since 1997. Numerous seismic surveys have been carried out in this location to
explore the location of gas hydrate, as well as the geological structure of
Ulleung basin. Most of field data sets of gas hydrate have processed
conventionally and reported by Korea Institute of Geosciences and Mineral
Resources (KIGAM). The exploration results reported by Ryu et al. [9] showed
that the strong BSR, blank zones and chimney structure occur in some seismic
sections, that indicated the existence of gas hydrate in which the BSR occurs
most commonly in the seismic data of gas hydrate location. Thus, it will be a
target of gas hydrate seismic exploration. BSR, known as the boundary between
free gas and gas hydrate has several characteristics in the seismic data, such
as parallel to the sea bottom, high amplitude, reducing the interval velocity
and phase reverse to the sea bottom reflector. Consequently, the seismic data
processing has been trying to find out those criteria in the seismic data for
further analysis. Complex analysis, introduced by Jang et al. [2], has been
used for such those purposes. As mentioned previously, the phase and amplitude
of seismic data depend much on the reflectivity of the subsurface. Thus, the
reflectivity profile of the subsurface obtained from deconvolution of stack
image could aim to identify the BSR location of seismic section for the Gas
hydrate exploration.
The scopes of
study presenting in this research is: 1) review on the seismic properties of
sedimentary bearing with gas hydrate and its contribution to the seismic
attribute analysis; 2) summarize principle of the l1 norm inversion algorithm and its accurate
verification by synthetic trace; and 3) application of l1 norm inversion to the real gas hydrate seismic data
acquired by KIGAM in 2000 for BSR analysis.
II. REVIEW ON GAS HYDRATE AND SEISMIC PROPERTIES OF GAS HYDRATE- BEARING SEDIMENTS
Gas hydrate
(Fig. 1), the solid-like substance, is composed of methane molecule at the
centre and number of surrounding water molecule. It has been paid more
attention to study for two delicates because: 1) It can be considered as a new
energy resources; 2) One of reasons causing the instability of sea floor slope;
and 3) A factor of the climate change. The gas hydrate stability zone (GHSZ)
(Fig. 2) occurs naturally beneath the sea bottom or in a permafrost area where
the sedimentary is high organic carbon concentration. As gas hydrate is very
sensitive to the heat and pressure, the existence of GHSZ (Fig. 2) depends on
sea-floor temperature, thermal gradient and availability of organic carbon in
the sediments. Similar to the petroleum system, the gas hydrate system needs
three important geological features including: in situ generation of methane
(source rock), clathratisation of conventional reservoir (reservoir rock) and
baffling of gas seepage (trap) [1]. Seismic reflection is the most powerful
tool for gas hydrate exploration. One of very interesting events occurring in
seismic data is blank zone or chimney structure, which indicates for the gas
seepage. The other important indicator for gas hydrate existence in the seismic
data is BSR, which appears at the boundary between gas hydrate and free gas
zone due to much different velocities between gas hydrate and free gas zone. If
the velocity of gas hydrate-bearing sediments is obtained, the gas hydrate
concentration can be qualified.
The
compressional and shear velocities of gas hydrate-bearing sediments will change
significantly to the ones consisting of flow fluid, such as free gas or water,
whereas its density does not change much. Some empirical approaches have been
proposed to predict the velocity of gas hydrate-bearing sediments such as time
average equation [14], Woods equation [13], Kuster-Toksoz equation [4] and
weighted equation [5]. The elastic properties of such materials are shown in
Tab. 1. These parameters are used to determine the velocity of gas
hydrate-bearing sediments based on above prediction method and the results are
shown in Fig. 3.
|
Figure 1. Gas hydrate compound
[1]. |
Figure 2. The GHSZ inserts
depicting the pressure and temperature profile in well [1]. |
Table 1. The basic elastic constants of various materials of
sedimentary rock [5].
|
Components |
Vp (km/s) |
Vs (km/s) |
ρ (g/cm3) |
K (GPa) |
G (GPa) |
Remarks |
|
|
Water |
1.50 |
0.00 |
1.00 |
2.25 |
0.00 |
|
|
|
Hydrate |
3.30 |
1.68 |
0.90 |
6.40 |
2.55 |
Lee et al., 1996 |
|
|
Ice |
3.80 |
2.00 |
0.92 |
8.40 |
3.70 |
King, 1984 |
|
|
Sand (quartz) |
5.98 |
4.04 |
2.70 |
38.00 |
44.00 |
Tokoz et al., 1976 |
|
|
Clay |
3.40 |
1.60 |
2.60 |
21.20 |
6.67 |
Tosaya and Nur, 1982 |
|
|
Matrix |
4.37 |
2.60 |
2.70 |
27.20 |
18.30 |
Lee et al., 1996 |
|
|
|
|
|
|
|
|
|
|
|
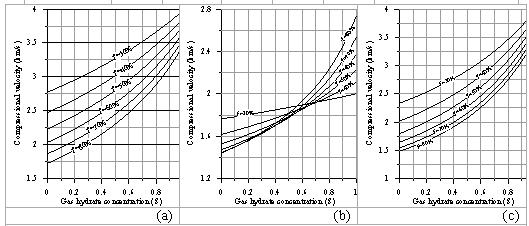
Figure 3. Predicted velocity. |
||||||||
These
calculations also help to qualify amount of gas hydrate associated with
sediments and as mentioned by Lee et al. [5], the weighted gave best prediction
velocity of gas hydrate-bearing sediments. As seen in Fig. 3, the velocity of
gas hydrate-bearing sediments is much higher than that consisting of free gas,
thus the high acoustic impedance contrast between gas hydrate and free gas
zone. Consequently, the BSR has high reflectivity. However, in some cases the
BSRs do not appear in seismic sections although the gas hydrate exists. The
occurrence of BSR in the seismic section may cause the several seismic features
such as phase, amplitude and frequency change significantly as reported by Jang
et al. [2] when the complex analysis was adopted.
III. l1 NORM INVERSION DECONVOLUTION
The seismic
trace x(t) is created by convolving the reflectivity r(t) and source wavelet
s(t) and additive noise term n(t) as given:
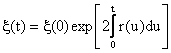
x(t) = r(t)*s(t) + n(t) (1)
where *
denotes for convolution operator.
The purpose of
deconvolution is to recover the reflectivity from the seismic trace if the
source wavelet is known or well estimated. If the subsurface is assumed to be
flat, the reflectivity function will be zero everywhere, except at those times τk correspoding to two way travel
time to kth layer
![]() (2)
(2)
where NL is
the total number of layers, and rk is the reflectivity coefficient
at the interface between kth and k+1th layer. The
acoustic impedance in the kth layer is defined as:
![]() (3)
(3)
where vk
and ρk is velocity
and density of kth layer, respectively. The reflectivity coefficient
at the base of kth layer depends upon the acoustic impedance
contrast and is given by:
![]() (4)
(4)
A
rearrangement of eq. (4) yields:
![]() (5)
(5)
The
relationship between acoustic impedance and reflectivity function is approximated
as [8, 12]:
![]() (6)
(6)
The solution
of above ordinary derivative equation is given as:
 (7)
(7)
where ![]() is surface impedance. Let us define:
is surface impedance. Let us define:
![]()
Thus, from eq.
(6) we have:
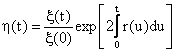 (8)
(8)
The linear
program approach is used to extract the information about r(t) used only
"appraisal" methods whose goals was to recover unique information
about the reflectivity in the form of averages <r(t)> = r(t)*a(t), where
a(t) is the averaging function [7]. The alternative way of extracting
information about reflectivity function is to write the discrete form of eq. (1)
![]() j = 1, 2, , N (9)
j = 1, 2, , N (9)
Eq. (9) can be
used to construct acceptable models, that is, function r(t) which reproduces
the data to within an error justified by their accuracy. The primary obstacle
for this approach is nonuniqueness. There are infinitely many acceptable modes
and they will not necessarily be similar. This nonuniqueness must be reduced if
the construction methods are to be useful, and in order to do this, more
information must be supplied. One of piece of information comes from the
assumption that the earth structure is adequately represented by sequence of
homogeneous layers. With that hypothesis, the reflectivity function could be
expressed in the mathematical form as given in eq. (2). The usefulness of eq.
(2) is discussed more detailed by Oldenburg et al. [7].
The extraction
of reflectivity function could be used the l1
norm, consequently minimize:
![]() (10)
(10)
or:
![]() (11)
(11)
Either Φ1 or Φ2 can be minimized, but the
minimization of Φ2 leads to
particularly simple results, using the definition of η(t) and eq.
(6), we obtain:
![]() (12)
(12)
Thus,
minimizing Φ2 is equivalent
to minimizing:
![]() (13)
(13)
In the time
discrete form of reflectivity function, r(t) can be expressed as:
![]() (14)
(14)
where N is
number of time sample and Δ is the time interval. Substitution of eq. (14) to eq. (13) yields
![]() (15)
(15)
as an
objective function to be minimized. The minimization of eq. (15) is precisely
the problem dealt with by Levy and Fullagar [6]. Their solution is briefly
outlined here. Taking the Fourier transform of eq. (14) and separating into
real and imaginary parts, we have![]()
and
![]() (16)
(16)
The most
straight forward estimate of Fourier transform of reflectivity Rj is
from Fourier transform of seismic trace (X) and source wavelet (W), that is:
![]() (17)
(17)
Actually, the
seismic trace is contaminated by noise and in practice the source wavelet can
only be approximated. Nevertheless, errors for the real and imaginary portions
of Rj can often be estimated and hence Re{Rj} and Im{Rj}
can be emitted as a constraint in the linear programming algorithm by requiring
![]() (18)
(18)
and
![]() (19)
(19)
where δj is the standard deviation of
Re{Rj} or Im{Rj} and α is some factor determining the
goodness of fit.
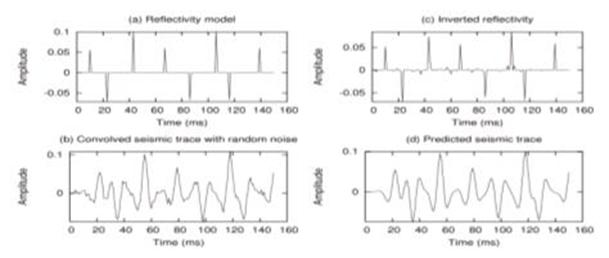
Figure 4. l1 norm
deconvolution result of the 1D synthetic seismic trace.
The detailed
linear programming is discussed by Odenburg et al. [7]. In order to verify the
algorithm, 1D synthetic trace is used to test the algorithm.
The result
algorithm of l1 norm is
shown in Fig. 4, where Fig. 4a shows the true reflectivity, Fig. 4b shows the
seismic trace convolving from the Ricker source wavelet (with central frequency
f = 20 Hz) and seismic reflectivity. The Gaussian random noise was added to the
seismic trace. Fig. 4c and Fig. 4d present the inverted reflectivity and
predicted seismic trace, respectively. Comparing Fig. 4a and Fig. 4c we may see
the result of l1 norm
inversion looks quite good in term of position and amplitude and Fig. 4d
indicates the improvement of the original seismic trace without noise term. The
synthetic example confirms the accuracy of algorithm and it could be used for
real data set analysis.
IV. APPLICATION OF l1 INVERSION TO GAS HYDRATE SEISMIC DATA
The purpose of
gas hydrate exploration is to find out the gas hydrate indicators in the
seismic section such as BSR, pull up structure and blanking amplitude zone in
which the BSR is the most common representative of gas hydrate seismic section.
There are several seismic attribute used to amplify the existence of BSR such
as amplitude versus offset (AVO) analysis, complex analysis. The first and
second derivative of amplitude are also used to analyze the BSR as introduced
by Jang et al. [2]. Interestingly, the result showed that phase, frequency,
amplitude, first and second derivatives of amplitude sections are all located
at the same boundary known as BSR due to significantly change of velocity
between gas hydrate and free gas zone as mentioned in previous section. Further
more, the velocity of sedimentary bearing with gas hydrate change nearly
proportionally with amount of gas hydrate concentration while the lithological
density does not change much. Thus, the acoustic impedance and reflectivity
will be highly contrasted between above and below the BSR. Consequently,
reflectivity and acoustic impedance could be as useful seismic attribute for
gas hydrate data analysis.
Table 2. Geometric and
acquisition parameters of seismic survey
|
Receiver
interval |
6.25 m |
|
Shot
interval |
12.5 m |
|
No. of
receiver per shot gather |
96 |
|
Offset |
50-643.75 m |
|
Total number
of shots |
8410 |
|
Number of
time samples |
4096 |
|
Time
interval |
1 ms |
|
Lowcut
filter |
5 Hz/18 dB |
|
Highcut
filter |
360 Hz / 73
dB |
The seismic
data were acquired in 2000 by KIGAM. The following processed data is a part of
line 10 that is highlighted. The geometric and acquisition parameters are given
in Tab. 2. Fig. 5 shows the work flow of conventional seismic data analysis
while Fig. 6a and Fig. 6b show the shot gather No. 4874 and its result of
preprocessed data for gas hydrate exploration in Ulleung basin, respectively.
All preprocess
and processed steps are performed by GEOBIT developed by Suh [10]. One of
advantages of GEOBIT is using the interactive velocity picking tool based on
X-window, which gives more accurate and unique picking velocity. So, the stack
data will give unique imaging of the subsurface. The result of the conventional
seismic data analysis is stack image that is used for geological interpretation
(Fig. 7).
The stack
image is known as removal of coherent noise and makes all seismic traces to be
zero offset traces. Consequently, each trace now can be considered as the
result of convolving seismic reflectivity and source wavelet. Thus, 1D l1 norm inversion
could be applied to individual traces of stacked section to obtain the
reflectivity. Gathering all inverted seismic reflectivity of each trace makes
full reflectivity to the stack data. The source wavelet mostly used for
approximation is zero wavelet or minimum wavelet. In this case, the zero phase
wavelet with central frequency equal to 20 Hz is used as wavelet approximation.
The inverted reflectivity section and convolved stack section obtained from l1 norm inversion method is
shown in Fig. 8 and Fig. 9, respectively. Let take an example of a single
seismic trace at position of 7.2 km from the beginning of analyzed survey line
including original seismic trace, inverted reflectivity, convolved trace and
acoustic impedance then plot in the same figure as shown in Fig. 10.
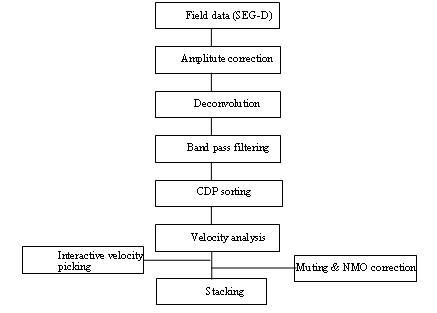
Figure 5. Work flow of conventional seismic processing.
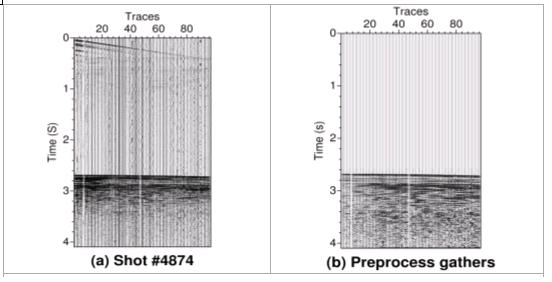
Figure 6. A shot gather and preprocessed result.
Closely look
at Fig. 10a and Fig. 10c, we may see the seismic trace and calculated trace are
almost similar that indicate the concise inversion of reflectivity. However,
according to the BSR criteria as mentioned above, it is quite difficult to
identify the BSR from the single trace in term of amplitude and phase. In Fig.
10d, we may see the acoustic impedance gradually increase to the two ways time
(TWT) of 3.2 second and then reduce rapidly, after that those values are kept
almost constant. Additionally, the reflectivity is highly reversed at the TWT
of 3.2 second. This information could indicate that the BSR is located at TWT
of 3.2 second. Similarly, the analysis of acoustic impedance and reflectivity
section could locate the BSR in the seismic section as indicated in Fig. 9.
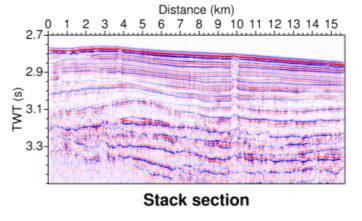
Figure 7. Stack image of gas hydrate data line #10.
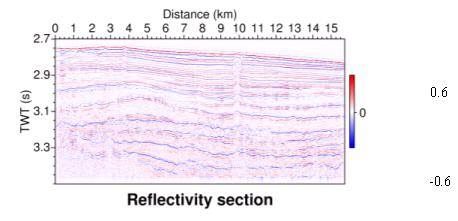
Figure 8. Inverted reflectivity of gas hydrate data line #10.
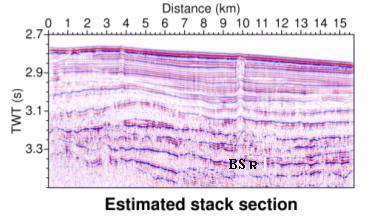
Figure 9. Calculated stack image from inverted reflectivity.
![]()
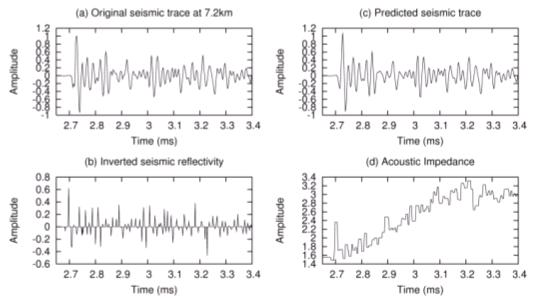
Figure 10. Inverted reflectivity and its acoustic impedance
of a single trace at the position of 7.2 km.
V. CONCLUSIONS
1. l1 inversion deconvolution
technique has been reviewed and verified its accuracy by the synthetic model.
The result shows that the inverted seismic reflectivity looks almost similar to
the original one and the estimated seismic trace has removed the multiples that
enhance the signals.
2. The seismic
velocity characterization of gas hydrate-bearing sediments leads to identifying
the BSR in the seismic section as an indicator of the existence of gas hydrate.
Consequently, BSR is a target of gas hydrate exploration.
3. The seismic
data processed by Geobit has been adopted successfully for gas hydrate data set
and the l1 norm inversion
has been also applied to the stack section to obtain the reflectivity and
improved seismic signal. Detailed analysis of reflectivity and acoustic
impedance clearly shows the BSR location in individual traces then for whole
seismic section.
ACNOWLEDGMENT
This research
was supported by the Contribution Project of the Korea Institute of Geosciences
and Mineral Resources (KIGAM) funded by the Ministry of Knowledge Economy of
Korea.
REFERENCES
1. Beauchamp
B., 2004. Natural gas
hydrate: Myths, facts and issues. J. of
C. R. Geoscience, 336: 751-765.
2. Jang S.,
Suh S., Ryu S., 2005. Complex analysis for gas hydrate seismic data.
3. King M.S.,
1984. The
influence of clay-sized on seismic velocity for Canadian artic permafrost.
4. Kuster
G.T., Toksoz M.N., 1974. Velocity and attenuation of seismic waves in two phase media. 1.
Theoretical formulation. Geophysics, 39:
587-606.
5. Lee M.W.,
6. Levy S.,
Fullagar P.K., 1981. Reconstruction of a sparse spike train from a portion of its spectrum
and application to high resolution deconvolution. Geophysics, 46: 1235-1243.
7.
8. Peterson
R.A., Fillipone W.A., Coker, F.B., 1955. The synthesis of seismograms from well log data. Geophysics, 20: 516-538.
9. Ryu B. et
al., 2003. Study on gas
hydrate exploration and development. KR-0300-09,
KIGAM.
10. Suh S.,
2005.
Geobit-2.10.14, the seismic data processing tools. KIGAM.
11. Tosaya C.,
Nur A., 1982. Effects of
diagenesis and clays on compressional velocities in rock. Geophys. Res. Lett., 9: 5-8.
11. Walker C.,
Ulrych T.J. , 1983. Autoregressive modelling of the acoustic impedance. Geophysics, 48/10: 1338-1350.
12. Waters
K.H., 1978. Reflection
seismology, a tool for energy resource exploration. John Wiley and Sons,
13. Wood W.T.,
Stoffa P.L., T.H. Shipley, 1994. Quantitative detection of methane hydrate through high resolution
seismic velocity analysis. J. of Geoph.
Res., 99: 9681-9695.
14. Wyllie
M.R.J., Gregory A.R., Gardner G.H.F., 1958. An experimental investigation of factors affecting elastic wave
velocities in porous media. Geophysics,
V/23: 459-493.