I. FREQUENCY-MAGNITUDE RELATIONSHIP FOR GLOBAL SEISMICITY
First, we build the
recurrence curve of earthquakes. The straight-line Gütenberg-Richter relationship
is: lgN = a - gM,
Where N - average of earthquakes, the magnitude
of which lies in an interval of [M-DM, M+DM]; a
and g - parameters of recurrence.
As demonstrates the analysis of the recurrence
curve of earthquakes built on the data of the catalog, representing the events
with a magnitude of 4.5 and more. Thus, the global network registers without
the miss of event with a magnitude greater than 4.5. In this connection the
further analysis is conducted for events with a magnitude greater than 4.5.
Since the magnitude of 4.5, the frequency-magnitude relationship is practically
linear with small downwards since the magnitude of 8.0. The slope of the
frequency-magnitude relationship is -1.04 and a = 9.85.
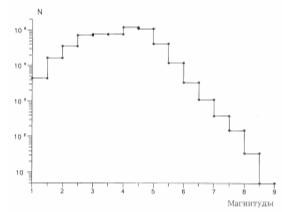
Figure 1. Frequency-magnitude relationship
for global seismicity.
It is easy to be convinced that the power contribution
of weak earthquakes (M < 4.5) in
global seismicity is rather minute. The fraction of energy of gentle
earthquakes does not surpass 0.333 % from the common seismic energy for period
of from 1973 to 2007, which has compounded about 1025 ergs.
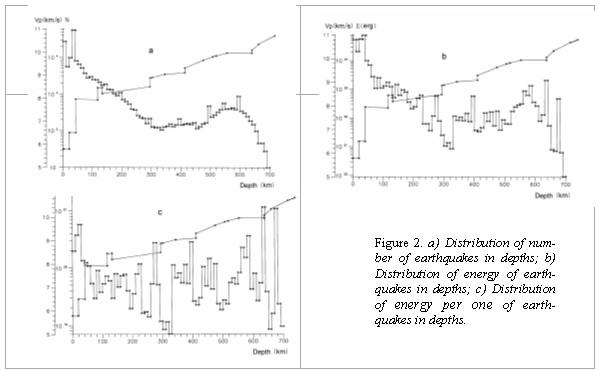
II. DISTRIBUTION OF EARTHQUAKES IN DEPTH
Let us look, as the earthquakes in depth have arranged.
Along with the distribution of change of number of earthquakes for earthquakes
with miscellaneous magnitudes, the distribution of free seismic energy has
built. In the Fig. 2а is distribution of a velocity curve of P-waves for the upper and middle
mantle and distribution of number of earthquakes in depth.
From the distribution in the figure, it is well
visible, that most of earthquakes take place in earth crust in the depth of
0-10 km and 30-40 km. Then there is a monotonic waning of number of earthquakes
with depth, down to the depth of 300 km. On an interval of depths of 300-450 km
the number of earthquakes remains to an approximate constant, and then there is
an increase of number of earthquakes up to the depth of 600 km. The ambassador
of 600 km is a sharp decay of seismicity on number of earthquakes.
Diverse picture have be seen in a Fig. 2b and 2c. On Fig. 2b, the distribution
of the seismic energy in miscellaneous depths is shown. In this figure the
distribution curve does not such smoothly vary, as in the Fig. 6а. The splashes of seismic
energy in the depths of 220, 270, 400, 640 and 670 km are especially
appreciable, i.e. there, where the splashes on the distribution of number of
earthquakes in depth miss.
The even more expressive
picture has be seen in the Fig. 2c, where the energy distribution with depth,
coming on one earthquake in a ten-km layer is shown. Here, splashes of a
maximum liberated energy has more and, that is interesting in depths of 220,
270, 400, 640 and 670 km they have dated for the applicable boundaries. Moreover,
from the distribution in the Fig. 2b follows, that in depths of 640 and 670 km
the energy per one earthquake is more than in depth of 40 km, where there is an
overwhelming number of earthquakes. It means that in the zone C of mantle of
the Earth in depths of 640 and 670 km take place more intensive earthquakes,
than in zones A and B.
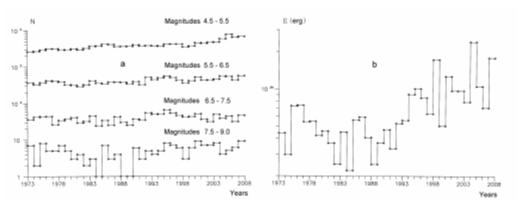
III. ANNUAL RELATION OF GLOBAL SEISMICITY
For analyzing the annual
relation of global seismicity the distribution of change of number of
earthquakes from one year to one year for 4 intervals of magnitudes have built:
7.5-9, 6.5-7.5, 5.5-6.5 and 4.5-5.5 (Fig. 3а), change of common seismic
energy (Fig. 3b) for period 1973 -2007. From consideration of this
distribution, it is visible that for earthquakes with magnitudes of from 7.5 up
to 9 some periodicity or repetition of the form in intervals 1973-1989 and 1990-2007
(Fig. 3а) has watched. Thus, the general number of earthquakes in the second
period is more little, than in maiden. That can be told and about earthquakes
with magnitudes of from 6.5 up to 7.5. For earthquakes with magnitudes of from
5.5 up to 6.5 such relations to observe is difficult. The distribution for
earthquakes with magnitudes of from 4.5 up to 5.5 interestingly behaves. It has
the obvious tendency to ascending number of earthquakes with years. It have
been connected to two reasons. First is really increased of number of gentle
earthquakes from one year by one year. Second, bound with increased of number
and sensitivity of seismic stations.
On the chart, introduced
in a Fig. 3b the increase of seismic energy, since 1990 is well tracked. Thus
abnormal on liberated number of energy are 1994-1996, 1998, 2000, 2004 and
2007.