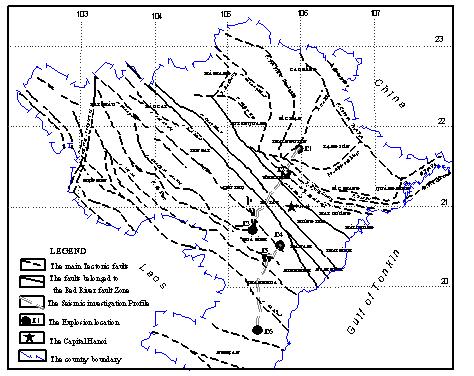
Figure 1. Distribution of seismic investigation
profiles.
THE FIRST DEEP SEISMIC INVESTIGATIONS IN NORTH
VIỆT
1ĐINH VĂN TOÀN, 2STEVEN
HARDER, 3PHẠM NĂNG VŨ, 1TRỊNH VIỆT BẮC,
1ĐOÀN VĂN TUYẾN, 1LẠI HỢP PHÒNG, 1TRẦN ANH VŨ,
1NGUYỄN THỊ HỒNG QUANG
1Intitute
of Geological Sciences, VAST, 84, Chùa Láng Str., Hà Nội;
2Miller Geophysical
Laboratory, University of Texas at El Paso, USA;
3Hà Nội University of Geology
and Mining, Hà Nội.
Abstract: During the time period from December, 2007 to
February, 2008 for the first time were carried out two profiles of deep seismic
investigation in North Việt
I. INTRODUCTION
An
understanding of the crustal structure is a very important factor in the study
on the geotectonic history of any region. In the region of more complicated
geologo-geotectonic environment, the study of the Earth’s crust is more heavy
and often requires a denser network of geophysical measurements with the
application in certain areas of more reliable techniques, such as deep seismic
investigations. North Việt
Figure 1. Distribution of seismic investigation
profiles.
As a great
regional geological discontinuity, the activity of the Red River fault has been
playing a significant role in the formation of present-day geotectonic
environment not only in the southwestern part of China, North Việt Nam, but
also in the SE Asian countries. During the Cenozoic time the displacement
between the sides of the
Aiming to
receive more reliable information about the crustal structure of North Việt Nam
during the period of 2007-2008 time were carried out the first deep seismic
investigations along two profiles in North Việt Nam.
II. DEPLOYMENT OF INSTRUMENTS AND DATA COLLECTION
The
instruments used in this study are produced by the USA Refraction Technology
Company (Reftek-125) and supplied by the Miller Geophysical Laboratory,
The target
of our investigation is a better understanding the position of the main
tectonic fault systems, the distribution of the main interface in the Earth’s
crust along the observational profiles, such as crystalline basement, Moho
surface and maybe the middle crust, where this boundary exists.
As
mentioned above, the main structures in North Việt
The second
profile starts from the southern side of the Red River fault (Fig. 1) at the
point 105.70° E; 20.52° N extending southward in the submeridian direction and
finishes at the point 105.39° E; 19.49° N. This profile passes most the main
systems of tectonic faults of NW-SE trending in the Southwest region of
For
producing seismic waves in this study were conducted the explosions at three
positions along each profile. In every shot point the explosions were carried
out in two boreholes at the depths of from 26 to 32 m with Emulsion-NT
explosive mass of from 500 to more than 1000 kg. For the data collection 200
instruments were deployed along each profile. The GPS time was synchronized for
every instrument just before installation. The spacing between the seismometers
on the profile varies from less than 500 to 700 m. The collected data showed
that, 2 to 4 instruments deployed along the first and second profiles did not record
signal.
III. PRELIMINARY RESULTS OF DATA PROCESSING
The first
step in the seismic investigation is the conversion of the collected data into
SEGY format, that can be accessed by different seismic data processing package
of programs. In our study the package of programs SeisUnix developed by the
Center for wave phenomena, Colorado School of Mines and IxSeg2Segy developed by
Interpex Limited was used. During this step, the positions and elevations of
the surveyed points are integrated with seismic data. The desire time window of
wave field is cut from the larger record. Due to the thickness of the Earth’s
crust under the investigated profiles estimated as less than 35 km, the time
windows are choosen as 17 and 27 seconds of duration. To reduce the influence
of noise the banpass filtering technique in the frequency range of from 1 to 20
Hz was applied. The summing of the wave
fields produced by two separated explosions at the same shot location was
conducted after the filtering. For more easily watching the wave form in
seismic sections a 6.0 km/sec reducing velocity was used. That is the
source-receiver distance divided by 6.0 km/sec, which yields the time in
seconds. Each trace was then moved
earlier in time by this amount. This operation allowed us to obtain the seismic
section more rectangular with arrivals coming in near horizontal rather than
diagonal. Next step in our data processing is the application of automatic gain
control with a 5-second window. It is expected to increase the amplitude of later
wave arrivals, such as PmP (reflection from the Moho). The wave sections were
plotted by using GMT package of programs (Generic mapping tools) with
time-distance dependence on the graph.
Six seismic
sections were derived from six explosion locations along both profiles; among
them the wave field generated by the explosions in the second explosion
location E2 of the first profile (Phổ Yên location) is much better than the
others (Fig. 2). On this seismic wave section we can see clearly the main
reclection interfaces with two way travel time approximating 0.2, 5.0 and 9.0
sec. at the place surrounding the shot point. In accordance to the Earth’s
structure obtained from previous studies these reflection boundaries
demonstrate the seismic signal from the crystalline basement, the middle
crustal interface and the Moho under the northern surveyed profile T1. The
capacity of this explosion is not the largest among the explosions done in this
experiment, maybe because the geological environment surrounding the explosion
boreholes is more capable to produce seismic waves of higher amplitude.
Probably the rock in the thick weathered layer as well as in the underlying
bedrock in this location is softer in comparing with other shot points. The
evidence is indicated by smaller seismic wave velocities detemined by the
shallow seismic exploration conducted for all the explosion places before
drilling. On other hand, the rich groundwater environment here may be also the
reason causing larger amplitude of seismic wave from this location. Obviously
the reflection signals from the crustal interfaces in the area of the
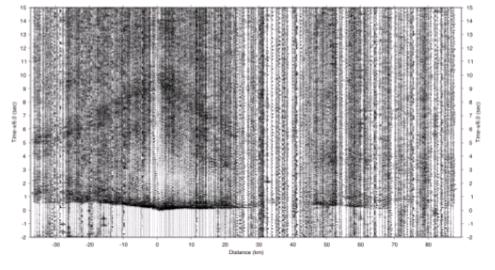
Figure 2. Seismic wave section produced by shots
at Phổ Yên (E2) (Explosion capacity: 760 kg).
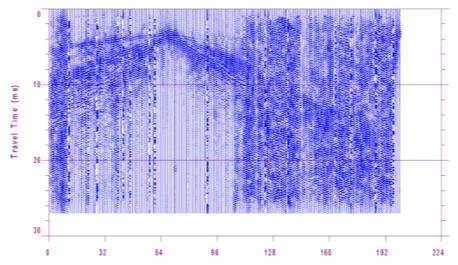
Figure 3. Seismic wave section of profile T1
after summing two seismic wave sections produced by shots at Phổ Yên (E2) and
Hòa Bình (E3).
probably
caused by harder rocks detected by higher seimic wave velocity in the
subsurface soil and bedrock layers and then the drilling in those places. The
poor water content in the geological environment of these locations is also
prevented generation of seismic wave of larger amplitude. Obviously, the noise
created by human activities is also a factor reducing the signal/noise ratio,
because all explosions were done in day time and, of course, it is affected by
the quality of the seismic wave sections. However, the summing of the wave
sections produced by explosions in two or three locations along the same
profile indicates a better correlation between the wave fields and structural
elements of the Earth’s crust (Fig. 3, 5).
The seismic section demonstrated on the Fig. 4 is derived from the
summing of wave fields produced by the explosions in E2 (Phổ Yên) and E3 (Hòa
Bình) locations. The seismic wave interfaces appear in the section similarly to
the wave field in Fig. 2. In fact, the summing wave section is included the
wave field from the Fig. 2. Related to the seismic wave sections obtained from
the southern profile T2 the situation changes in the summing of all the three
wave sections produced by explosion from the three locations along the profile.
It is difficult to watch for the seismic interface on separated wave fields
(Fig. 4), but in the summing wave section the seismic boundaries seem to appear
on the result feature (Fig .5).
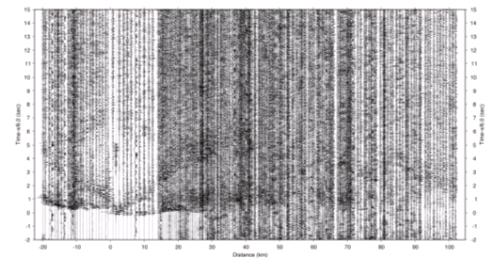
Figure 4. Seismic wave section of profile T2
produced by shots at the middle point An Nghĩa (E4) (Explosion capacity: 1005
kg).
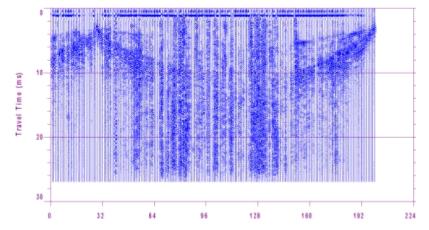
Figure 5. Seismic wave section of profile T2
after summing the seismic wave fields produced by shots at 3 locations (E4, E5
and E6).
The first
estimation of the depths to the main boundaries of the Earth’s crust is applied
for the seismic section in Fig. 1 by using 1D velocity model of three layers.
The calculation was carried out by Dr. Steven Harder. The depths to the
crystalline basement, the middle crust and Moho surface received from the
calculation are approximately 0.9 km, 15.0 km and 27.0 km with P-wave
velocities 5.0, 6.0 and 6.6 km/sec respectively in the three layers.
IV. DISCUSSION AND CONCLUSIONS
1. The
preliminary results of data processing
have been indicating a possibility of using first deep seismic investigations
in Việt
2. The
crust thickness obtained from the first estimations from seismic data is
thinner more than 3 km in comparison with results from previous studies by
using the gravity data. The results may change later, because the first model
applied for calculation is very simple, meanwhile the Earth’s crust in North Việt
3. The
seismic wave is much better generated in the location of softer rock layers and
rich water content. It is not easy to find this kind of location for doing
explosion in the dense population areas like Việt
Acknowledgments: We would like to
acknowledge the field work help provided by scientists of the Institute of
Geological Sciences, the drilling teams of Hải Quang, Đông Ích companies, the
Bắc Trung Bộ Geological Division, the Faculty of Geology, Hà Nội University of
Natural Sciences as well as the North Trung Bộ and Việt Bắc Companies of Mining
Chemical Industry. We also would like to express the deep thanks to J.W. Miller
Geophysical Laboratory, University of Texas at El Paso, USA for providing of
the instruments, technology and
experience for the experiments.
The
investigations were covered by Việt Nam National Project No. KC.08.06.
REFERENCES
1. Brink Uri S. Ten, Abdallash S. Al-Zoubi, Steven Harder et al., 2006. Seismic
imaging of low velocity zone beneath the
2. Cao Đình Triều, S. Tatiana, 2008. Mô hình cấu trúc vận tốc
sóng P khu vực Đông Nam Á. TC CKHvTĐ, 30/2 : 176-184. Hà Nội.
3. Desert Group, 2004. The crustal structure of the
4. Đặng Thanh Hải, 2003. Nghiên cứu một số đặc điểm cấu
trúc vỏ Trái đất và phân vùng địa chấn kiến tạo miền Bắc Việt
5. Liu Fu-Tian, Wu Hua, Liu
Jian-Hua, et al., 1990. 3D velocity images beneath the Chinese
continent and adjancent regions. Geophys. J. Int., 101 : 379-394.
6. Mooney W.D., 2001. The crustal structure of
7. Nguyễn Ngọc Thuỷ, 1999. Seismic velocity structure in
North Việt
8. Wu Hsin-Hung, Y-Ben Tsai, Tung-Yi Lee, Ching-Hua Lo, Dinh Van Toan,
2005. 3-D shear wave velocity structure of the crust and upper mantle in