Figure 1. Resistivity change in time, T1, T1b , T1c.
2D RESISTIVITY SURVEY IN ĐỒNG THANH OLD
SANITARY LANDFILLS, HỒ CHÍ MINH CITY
1LÊ NGỌC THANH, 2NGUYỄN
THÀNH VẤN, 1NGUYỄN QUANG DŨNG
1NGUYỄN THỤY NGỌC HÂN, 1DƯƠNG BÁ MẪN
1Hồ Chí Minh City Institute of
Geographical Resources, VAST,
2Faculty of Physics,
Abstract:
At present, the Hồ Chí Minh City (South Việt
The paper presents the results of 2D resistivity survey at Đồng Thanh old
sanitary landfills in the southwest of Hồ Chí Minh City.
I. INTRODUCTION
In recent years, the
increasing socio-economic development in Hồ Chí Minh City produces a big amount
of waste. Although it is collected in an area of suitable processing
technology, but in fact it always affects environment, especially the
surrounding groundwater.
The Đồng Thanh sanitary
landfill that is located in 15 km northwest of Hồ Chí Minh City centre and 32
ha in area, came into operation in 1988 and was closed in 2000. The
contamination of groundwater caused by it brought serious damage to the
rice-field, fruits and raised fishes in this area in 2000 year. Therefore, it
is necessary to carry out groundwater monitoring so that it can be reduced in
damages to the minimum.
II. DATA ACQUISITION AND PROCESSING
The ABEM Land Imaging System used for data
acquisition is composed of four electrode cables, each of them has 21
take-outs, with the take-out distance of 5 m. The data acquisition is carried
out by CVES method. The true resistivity structure is interpreted with the
RES2DINV software (Loke and Barker, 1996).
III. GEOLOGY OF THE SURVEY AREA
From the engineering
geology side, the survey area is composed of horizontal beds of Pleistocene
sediments. The lithological description of borehole BH1 is as follows:
- 0 - 0.8 m: Surface soil,
grey-yellow clay;
- 0.8 - 4.2 m: Firm, grey
sandy clay;
- 4.2 - 7.0 m: Red-yellow
laterite gravels and silty sand; coefficient of permeability k = 1.1×10⁻⁵ cm/sec;
|
Sediments |
Resistivity (ohm.m) |
|
Silty clay |
5 -15 |
|
Clayish
sand |
20 - 60 |
|
Gravel
sand |
40 -100 |
|
Natural
water |
100 - 120 |
|
Contaminated
water |
< 10 |
- 7.0 - 7.2 m: Grey-yellow,
firm clay with fine-grained sand lenses;
- 7.2 - 13.2 m: Clay mixed
with grey-yellow silty sand; coefficient of permeability k = 1.7×10⁻⁴ cm/sec;
- 13.2 - 20 m: Yellow-red
medium-grained sand.
Resistivity
range of Pleistocene sedimentary materials in the survey area has been estimated
as follows (Tab. 1).
IV. DATA INTERPRETATION
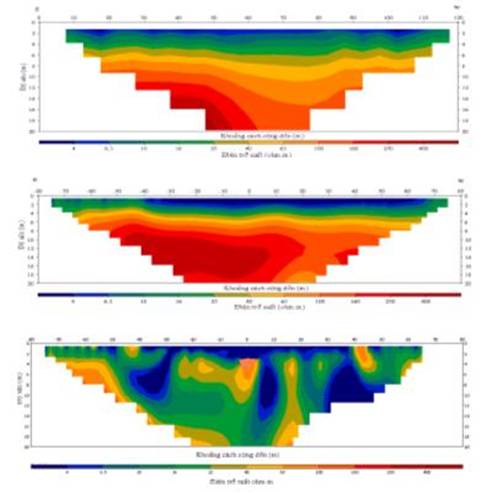
1. Resistivity change in time
The comparison of three
interpreted resistivity-depth sections in three different periods is presented
as follows (Fig. 1):
1. Section T1 (dry season, Dec.
2004), the resistivity distribution is of horizon, from a few to 100 ohm.m,
from 2 to 10 m in depth;
2. Section T1b (rainy
season, May 2005), the resistivity distribution does almost not change, but the
resistivity gradient in depth increases, i.e. over 6 months of dry season the
soil from 2 to 10 m in depth becomes firmer.
3. Section T1c (rainy
season, Nov. 2005), the resistivity much changes: there exists high
conductivity blocks (resistivity less than 6 ohm.m). It may be the contaminated
groundwater.
Figure 1. Resistivity change in time, T1, T1b , T1c.
2. Resistivity change in space
The high conductivity blocks in three
interpreted resistivity-depth sections are presented as follows (Fig. 2):
4. Section T1c (rainy season, Nov. 2005),
as described above.
5. Section T2 (rainy season, Nov. 2005),
18 m far from T1c.
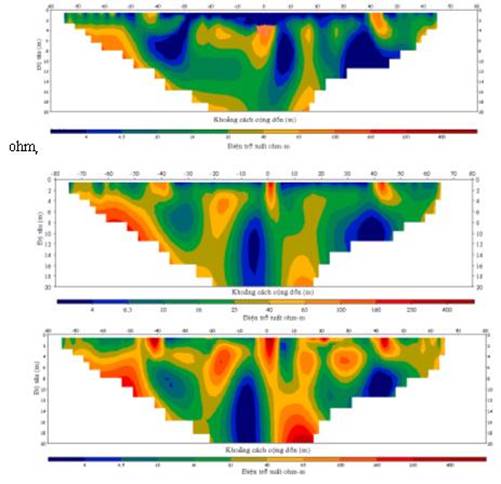
Figure
2. Resistivity change in space, T1c, T2 ,
T3.
6. Section T3 (rainy season, Nov. 2005),
18 m far from T2.
Comparing these three sections, it is
assumed that the velocity of pollution extension is 10 cm/day or 1.2 × 10⁻⁴
cm/sec at least.
V. CONCLUSION
The electrical imaging
method plays an important role in locating the pathways of contaminated
leakage. These results provide a reliable basis for drilling and sampling
works. In addition, the seismic refraction and GPR measurements should be
carried out to determine the geological structure of the landfill.
REFERENCES
1.
Berstone C., 1996.
Electromagnetic and DC resistivity mapping of waste deposits and industrial
sites: Experiences from
2.
Berstone C., 1996.
2D resistivity surveying of old landfills, Proc. 2nd European
EEGS meeting,
3. Loke
M.H., Barker R.D., 1996. Rapid least-squares inversion of apparent resistivity
pseudosections by a quasi-Newton method. Geoph. Prosp., 44/1.
4. Vu Dinh
Luu, Dang Ngoc Phan, 2001. Soil investigation data. Proj. on Đồng Thanhrubbish
site treatment.