I. INTRODUCTION
The
quantitative seismic hazard assessment is usually based on pre-developed source
models, which simulate the process of energy release and seismic wave
propagation of an earthquake from source to site. The seismic hazard models
allow to calculate hazard at a given point and then to construct the hazard map
for the entire study area.
Such
seismic hazard models were first developed and used by Cornell C., 1968 and
Milne W. and Davenport A., 1969. Implicit in all of these models is the
assumption that the total energy released by earthquakes radiated from the
focus of the earthquake, and therefore may be called “point-source models” [2,
7]. The application of the point-source models would not be accurate in case of
major earthquakes, when total energy released is distributed along the rupture
zone that could be several hundred kilometers long or when the site is located
very close to the fault. In general, the rupture length is a significant
parameter in the determination of seismic hazard, and neglecting its effect
would tend to underestimate the real risk to large-magnitude earthquakes.
To
overcome the disadvantages of point-source models, Der Kiureghian A. and Ang
A., 1977 at the same time with Douglas B. and Ryall A., 1977 proposed a
fault-source model, which is based on the assumption that an earthquake
originates at the focus and propagates as an intermittent series of fault
ruptures or slips in the rupture zone of the Earth crust, and that the maximum
intensity of ground shaking at a site is determined by the slip that is closest
to the site [3, 4].
In
this paper, the development of a fault-source model for seismic hazard
assessment and risk analysis in Việt Nam is described. GIS technology is
used to create powerful tools for calculating and mapping hazard, then
displaying outputs and permits users to “see” the effects of different
earthquake scenarios and assumptions. Two examples of the use of fault-source
model in seismic hazard assessment and risk analysis in Việt Nam at regional as well as urban
scales are given.
II. DATABASE OF SEISMICALLY ACTIVE FAULT SYSTEMS
IN VIỆT NAM
In
order to develop a fault-source model for Việt Nam,
a database of 46 seismically active faults systems in the territory and
continental shelf of Việt Nam
was created. Information of faults systems were taken from the studies,
previously published by some authors [1, 8]. The faults systems are grouped in
two ranks, depending on their depth of active layers and magnitude thresholds.
The fault systems are simplified and digitized as single polylines in a GIS
environment, and linked with their attribute data. There are two types of fault
attribute data stored in the database. The first type consists of descriptive
informations, including fault name, fault rank, type of faulting, main
direction, total length, etc... More important attribute type is the fault
parameters, which can be used directly in the hazard calculation as maximum
moment magnitude, surface and subsurface rupture sizes, dip angle, etc…
III. THEORETICAL BACKGROUND
The
relationship between earthquake magnitude M and rupture length L has been
investigated by many authors. A fault-source model of Việt Nam was developed, using the
relationship of Wells and Coppersmith (1994) given below [14]:
log10(L)
= (a + b). M (1)
Where
L is the rupture length (km) and M - moment magnitude of the earthquake; a and
b are regression coefficients, determined for different types of faults
and given in Table 1.
The
relationship between ground motion parameters Y, earthquake magnitude M and the
focal distance R, also known as the attenuation equation, can be expressed as
follows:
Y
= c1 exp (c2M) RC3 (2)
Where
Y is one of the peak ground motion
values (acceleration, velocity, or displacement); c1, c2
and c3 - spatial dependent constants.
Table 1. Regression
coefficients of fault rupture relationship of Wells and Coppersmith [13]
|
Rupture type
|
Fault type
|
a
|
b
|
|
Surface
|
Strike slip
Reverse
All
|
-3.55
-2.86
-3.22
|
0.74
0.63
0.69
|
|
Subsurface
|
Strike slip
Reverse
All
|
-2.57
-2.42
-2.44
|
0.62
0.58
0.59
|
In
our case, two ground motion parameters are used to express seismic hazard. The
first parameter is Peak Ground Acceleration (PGA), in units of gals, and the
other one is shaking intensity I, characterizing the strength of shaking on the
earth’s surface, reported on non-instrumental MSK-64 scale.
For
the PGA values, many attenuation equations have been defined by various
investigators for regions with different geological and geodynamic condition in
the world. Table 2 lists 10 most characteristic attenuation equations used for
the application of fault-source model of Việt Nam [10-13].
The
relationship between intensity I and the values of PGA is given in Table 3. The
conversion is not implemented in the cases, when I is less than level V, and
when I exceeds level X, for there is no practical meaning in engineering
seismology.
Table 3. Relationship between PGA values and
shaking intensity I (MSK-64 scale)
|
PGA
(gals)
|
Intensity I
|
|
0.015-0.03
|
V
|
|
0.03-0.06
|
VI
|
|
0.06-0.12
|
VII
|
|
0.12-0.24
|
VIII
|
|
0.24-0.49
|
IX
|
|
>
0.49
|
X
|
IV. PROCEDURE AND GIS TOOLS
Fault-source
model is applied to define earthquake scenarios to be used in seismic hazard
and risk assessment procedures in Việt Nam at two levels: regional and
urban. An earthquake scenario is the event, most likely to have occurred, and
with predefined parameters. In other words, earthquake scenario is a simulation
of an event in the past for predicting the effects of a future event.
A
simple algorithm of seismic hazard assessment for Việt Nam using a fault-source model is
shown in Fig. 1. As can be seen from the figure, this is a 4-steps procedure,
resulting in the ground shaking maps for the study area. The procedure starts
with definition of a studied area, then follows the selection of a fault from
GIS database, which is capable for an earthquake in the selected area. The
fault parameters are used to describe a source of the earthquake scenario
assumed to be originated on the chosen fault. Finally, a proper attenuation
equation is chosen for computation of seismic hazard of the study area,
according to the given scenario. Two layers denoting shaking maps of the study
area in terms of PGA and I values are automatically displayed at the end. A
GIS-based software called as F-hazard is created to help users with their
various options.
With
more sophisticate algorithm, the fault-source model is also applied to seismic
risk analysis and loss estimation in Việt Nam at urban scale. Additional
calculation modules were developed to enable the use of a combination of data
sets reflecting local site conditions as well as the elements at risk in the
study area. A GIS tool called as ArcRisk is developed for the urban case, with
function of a decision support system [10-12].
A
procedure for urban risk analysis and loss estimation is shown in Fig. 2. The
first two steps are similar to the ones described in the hazard assessment
procedure (see Fig. 1), however in this case the chosen study area follows
administrative boundaries such as city, district(s) or ward(s) limits. On the
basis of existing data on seismicity, seismo-tectonics, engineering geology and
local site conditions, the ground motion is assessed for the study area. The
ground motion characteristics obtained then are used as input data for
assessment of ground failure due to liquefaction and landslides during
earthquake. Finally, information on vulnerability of elements at risk, such as
demographic and infrastructure data, can be used in combination with ground
failure outputs to evaluate risk and estimate losses for the study area.
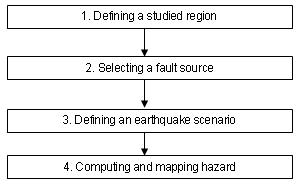
Figure 1. Procedure for seismic hazard
assessment using a fault-source model.
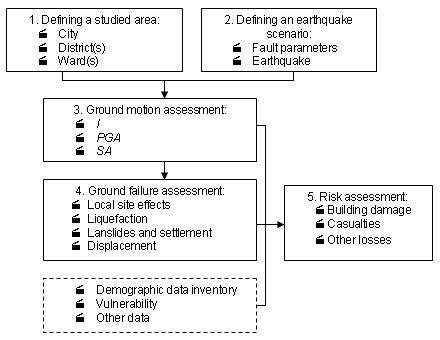
Figure 2. Procedure for urban risk analysis and loss
estimation
1. Seismic hazard assessment at regional scale
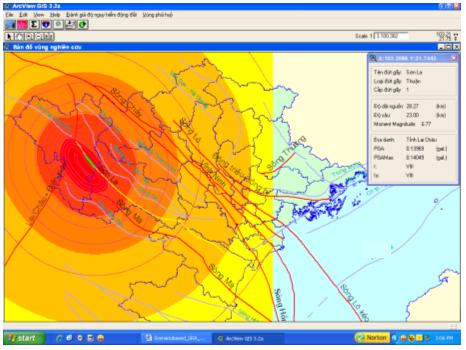
The
Program F-Hazard is used to simulate the Tuần Giáo earthquake of June 24th, 1983, the
greatest event ever observed and instrumentally recorded on the Vietnamese
territory. Information on this earthquake was taken from previous publications
[6]. With the assumption of the earthquake origination on Sơn La Fault, the
parameters of earthquake scenario are defined as follows:
1. The fault-source stretches in NW-SE
direction, with a normal, right-lateral strike slip mechanism. The fault
surface plunges northeastward with a dip angle of γ = 750;
2. Epicentre coordinates are φ = 103.43 E; λ = 21.71
N;
3.
MW = 6.77 (converted from MS = 6.7);
4.
Focal depth H = 23 km.
Fig.
4 shows a PGA map calculated from Tuần Giáo
scenario, using the attenuation equation developed for Yunnan
region, China
by Xiang Jianguang and Gao Dong [13]. Spatial query tool allows to display the
shaking value calculated at any point on the map in the small top-right corner
window. Within the Vietnamese territory, while the maximum intensity of VIII-IX
(and the value of PGAMax = 0.1409 gals accordingly) is observed in Lai Châu and
Sơn La provinces, the attenuating shaking with intensity VII also affects the
adjacent Yên Bái and Lào Cai provinces. The query for Hà Nội City results in
the intensity IV on MSK-64 scale.
The
results obtained from the fault-source application show a good accordance to
the observation data. Thus, the fault rupture length calculated by the Wells
and Coppersmith equation is 26.27 km, which coincides with that described from
the witnesses at epicentral area [6]. On the other hand, the maximum PGA value
calculated from the scenario is also in good accordance with the previously
published hazard value, defined for the Northwest Việt Nam by probabilistic method [9].
It
should be noted, that calculated hazard is clearly influenced by the used fault
parameters. For instance, modification of the dip angle values can lead to the
change in geometry of shaking contours. As can be seen in Fig. 3, the maximal
isoseismic zone is located asymmetrically on the source fault, unlike the
earlier published isoseismic maps [6]. This fact emphasizes the advantages of
fault-source models over the point-source ones.
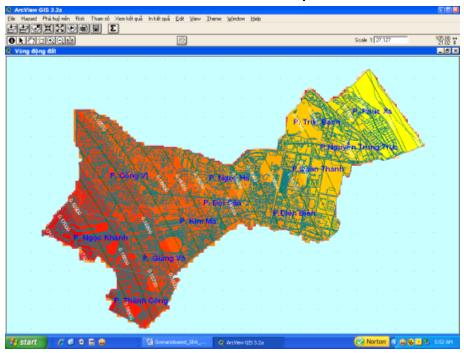
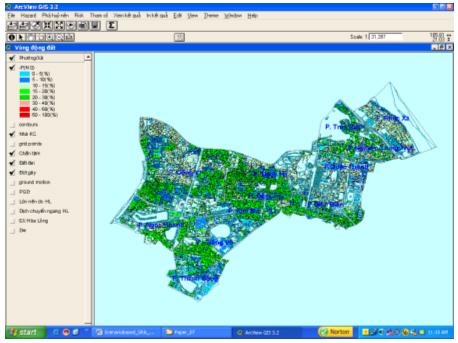
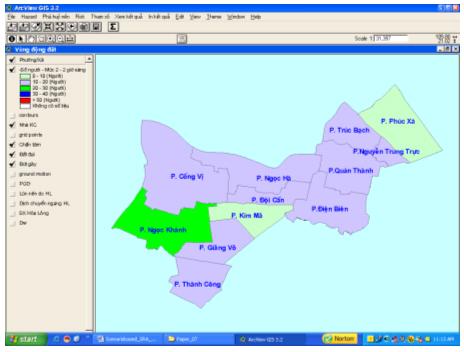
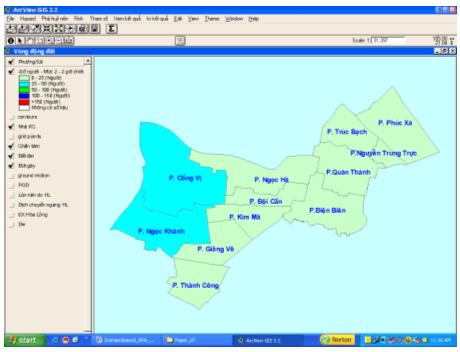
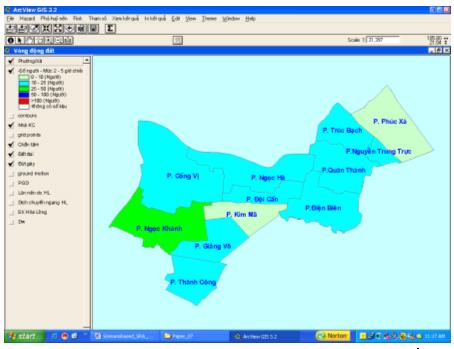
2. Seismic risk assessment at urban scale
This
example shows the application of fault-source model to seismic risk assessment
and loss estimation for downtown area of Hà Nội. Building damage and casualties
caused by one of the earthquake scenarios, assumed to be originated on Chảy River
active fault, crossing the territory of the city are calculated by using
program ArcRisk [11]. The results obtained for the Ba Đình District are
illustrated.
The
parameters of the Chảy
River source fault are
defined as follows:
1. The fault-source
stretches in NW-SE direction, with a normal, right-lateral strike slip
mechanism. The fault surface plunges northeastward with a dip angle of γ = 700;
2. Epicentre
coordinates are φ= 105.34 E; λ = 20.99 N;
3. MW = 6.6;
4. Focal depth H = 15 km.
In this scenario, the maximal earthquake
magnitude, predicted for the whole Hà Nội area and the Yunnan attenuation equation are used.
ArcRisk allows to apply a comprehensive procedure including seismic hazard
assessment (through the ground motion and ground failure evaluation) and
seismic risk analysis (through the building damage and casualties estimation)
for chosen area. The results are automatically displayed in a GIS environment.
For
each chosen area, the ground motion assessment results in the following: 1. A set of Peak Ground Acceleration maps, compiled for different time
periods and exceedance probabilities; 2. A set of Spectral Acceleration maps,
compiled for different time and vibration periods.
Similarly,
the ground failure assessment results in the following: 1. Liquefaction
susceptibility map; 2. Landslide susceptibility map; 3. Map of probability of
liquefaction; 4. Map of probability of landslide; 5. Map of ground settlement
due to liquefaction; 6. Map of ground lateral spreading due to liquefaction; 7.
Map of ground lateral spreading due to landslide.
Urban
loss is evaluated for two elements at risk, namely the buildings and people.
Accordingly, the outputs are presented in the form of two map sets. The first
one is a set of maps, showing building damage in different state of damage,
such as slight, moderate, extensive and complete. The second one is a set of
maps, showing number of casualties in every ward, at four severity levels and
at three different daytimes. Detailed description of methodology can be found
in [10, 11].
Some
main results obtained from the Chảy
River scenario are
illustrated in this paper. Fig. 4 shows the shaking map of Ba Đình District, in
terms of PGA (gals). In Figs. 5 and 6 (a, b, c) the distribution of extensive
building damage and casualties at 2nd severity level are shown.
VI. CONCLUSIONS
In
this paper, the development of a fault-source model for deterministic seismic
hazard assessment in Việt Nam
is described. The model is developed on the basis of a data set on seismically
active faults defined and published for the whole territory and the continental
shelf of Việt Nam,
with assumption that earthquakes are originated on seismically active tectonic
faults. Wells and Coppersmith equation on the relation between earthquake and
fault parameters [13] and 10 attenuation equations for regions with different
seismotectonic regimes are included in the model.
Based
on the model, two GIS-based tools are created for seismic risk analysis in Việt
Nam
at various scales, from regional to urban. The specific functions of these
tools also give the users options for selecting the studied area, source
parameters and attenuation law for risk calculation. The extent and level of
risk due to earthquake scenarios are depicted in a variety of GIS maps,
automatically generated in a GIS environment.
The
model was applied to a scenario of Tuần Giáo earthquake of June 24th, 1983 to investigate the
effect of fault source model on the calculated hazards at regional scale. The
good accordance between calculated results and observation data shows advantage
of the fault-source model over the point-source one in seismic hazard
assessment.
Another
application of the model is to assess risk and estimate losses from earthquake
scenarios at urban scale. The results obtained from a scenario applied to Hà
Nội City show the advantages of the used methodology and technique. Application
of deterministic seismic risk analysis based on earthquake scenarios can have
important contribution in seismic zoning, urban planning and risk management
for high priority areas and mega-cities of Việt Nam.
REFERENCES
1. Cao Đình Triều, Phạm Huy Long, 2002. Tectonic faults on the territory
of Việt Nam. Sci. & Techn. Publ. House, Hà Nội (in Vietnamese).
2.
Cornell C.A.,
1968. Engineering seismic risk analysis. Bull. Seism. Soc. Am., 58/5 :
1583-1606.
3. Der
Kiureghian A., Ang A.S.-H., 1977. A fault rupture model
for seismic risk analysis. Bull. Seism. Soc. Am., 67/4 : 233-241.
4.
Douglas B. M., A. Ryall, 1977. Seismic risk in linear source
regions, with application to the San Adreas fault. Bull. Seism. Soc. Am., 67
: 729-754.
5.
Frankel A., Mueller C., Barndhart T., Perkins D., Leyendeker E.V., Dickman N.,
Hanson S., Hopper M., 1996. National
seismic-hazard maps: Documentation June 1996. USGS Open-File Rep. 96-532. US
Geol. Surv..
6. Institute
of Geophysics, 1990. The Tuần Giáo earthquake of June 24th, 1983. Sci. & Techn. Publ. House, Hà Nội (in
Vietnamese).
7. Milne
W.G., Davenport A.G., 1969. Distribution of earthquake risk in Canada.
Bull. Seism. Soc. Am., 59 : 729-754.
8.
Nguyen Hong Phuong, 1991. Probabilistic assessment of earthquake hazard in Vietnam based on seismotectonic
regionalization, Tectonophysics, 198 : 81-93. Elsevier.
9.
Nguyễn Hồng Phương, 1997. Probabilistic Earthquake Hazard Assessment
for Việt Nam
and adjacent regions. Proc. of the NCST
of Việt Nam,
9/1. Hà Nội.
10.
Nguyễn Hồng Phương, 2002. Assessment of earthquake risk for Hà Nội
City, Proj. No 01C-04/09-2001-2, Final
Rep., Hà Nội (in Vietnamese).
11.
Nguyễn Hồng Phương, 2007. Application of GIS technology for
modelling and assessment of urban risk for Hà Nội City. Proj. No DL/02-2006-2, Final rep., Hà Nội (in
Vietnamese).
12. Nguyễn Hồng Phương, Nguyễn Hồng Lan, Phạm Thanh
Lương, 2003. Spatial analysis models
as applied to seismic hazard evaluation. Advances
in Nat. Sci., 4/3 : 277-294. Hà Nội.
13. Xiang J.G., Gao D., 1994. The
strong ground motion records obtained in Lancang-Gengma earthquake in 1988, China,
and their application. Rep. at Intern. Worksh. on Seismotect. and Seism.
Hazard in SE Asia, Hà Nội.
14.
Wells D.L., Coppersmith K.J., 1994. New empirical relationships
among magnitude, rupture length, rupture width, and surface displacement. Bull.
Seism. Soc. Am., 84 : 974-1002.